. 2023 Aug 29;13(9):1328.
doi: 10.3390/biom13091328.

Biomarker Signature in Aqueous Humor Mirrors Lens Epithelial Cell Activation: New Biomolecular Aspects from Cataractogenic Myopia

Affiliations

Biomarker Signature in Aqueous Humor Mirrors Lens Epithelial Cell Activation: New Biomolecular Aspects from Cataractogenic Myopia

Maria De Piano et al. Biomolecules. .

Abstract

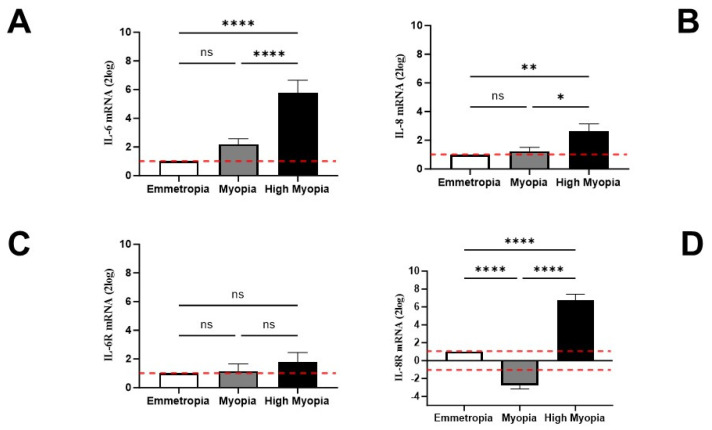
Inflammatory, vasculogenic, and profibrogenic factors have been previously reported in vitreous (VH) and aqueous (AH) humors in myopic patients who underwent cataract surgery. In light of this, we selected some mediators for AH and anterior-capsule-bearing lens epithelial cell (AC/LEC) analysis, and AH expression was correlated with LEC activation (epithelial-mesenchymal transition and EMT differentiation) and axial length (AL) elongation. In this study, AH (97; 41M/56F) and AC/LEC samples (78; 35M/43F) were collected from 102 patients who underwent surgery, and biosamples were grouped according to AL elongation. Biomolecular analyses were carried out for AH and LECs, while microscopical analyses were restricted to whole flattened AC/LECs. The results showed increased levels of interleukin (IL)-6, IL-8, and angiopoietin-2 (ANG)-2 and decreased levels of vascular endothelium growth factor (VEGF)-A were detected in AH depending on AL elongation. LECs showed EMT differentiation as confirmed by the expression of smooth muscle actin (α-SMA) and transforming growth factor (TGF)-βR1/TGFβ isoforms. A differential expression of IL-6R/IL-6, IL-8R/IL-8, and VEGF-R1/VEGF was observed in the LECs, and this expression correlated with AL elongation. The higher VEGF-A and lower VEGF-D transcript expressions were detected in highly myopic LECs, while no significant changes were monitored for VEGF-R transcripts. In conclusion, these findings provide a strong link between the AH protein signature and the EMT phenotype. Furthermore, the low VEGF-A/ANG-2 and the high VEGF-A/VEGF-D ratios in myopic AH might suggest a specific inflammatory and profibrogenic pattern in high myopia. The highly myopic AH profile might be a potential candidate for rating anterior chamber inflammation and predicting retinal distress at the time of cataract surgery.

Keywords: ETM; aqueous; biomarkers; cataract; inflammation; lens epithelial cells; myopia.


Conflict of interest statement

All authors certify that they have no affiliations with or involvement in any organization or entity with any financial or non-financial interest in the subject matter or the materials discussed in this manuscript. The funders had no role in the design of the study; in the collection, analysis, or interpretation of data; in the writing of the manuscript; or in the decision to publish the results.

Figures

Figure 1
Figure 1
IL-6, IL-8, VEGF-A, and ANG-2 protein levels in AH. Biosamples were collected and categorized according to axial length (AL) elongation (see MM). Microfluidic analysis detected increasing protein levels of IL-6 (A), IL-8 (B), and ANG2 (D) in high myopia and myopia subgroups as compared to emmetropia ones. All changes were AL-elongation-dependent. By contrast, VEGF-A levels (C) were reduced in myopia and high myopia with respect to emmetropia, and no difference was detected in myopia groups. IL-6, IL-8, and ANG2 levels were different between high myopia and myopia, but only ANG-2 levels were significant (D). Significant levels are shown in the panels (ns, not significant; * p ≤ 0.05; ** p ≤ 0.005; *** p ≤ 0.0005), as calculated using one-way ANOVA followed by a Tukey–Kramer post hoc test (mean ± SEM).
Figure 2
Figure 2
Lens epithelial cells (LECs) display α-smooth muscle actin (α-SMA) phenotypes and synthesize αSMA transcripts. AC/LEC specimens were prefixed at the time of sampling and subjected to specific analysis. (A) Representative α-SMA (merge: α-SMA/green and dapi/blue; epifluorescence) and PAS (light microscopy) images are shown. From left to right: upper panels: α-SMA/dapi immunoreactivity (upper panels); lower panels: PAS staining (lower panels) in emmetropia, myopia, and high myopia (magnifications, ×200; white bar, 100 µm). (B) Increased α-SMA immunoreactivity was quantified in highly myopic samples, as compared to myopic and emmetropic ones (* p < 0.05). IntDen values were obtained using ImageJ software after the channel split and the background normalization of images. (C) Molecular analysis showing increased α-SMAmRNA expressions in highly myopic (**** p < 0.0001) and myopic (p > 0.05) samples, as compared to emmetropic ones used as the control and referred to as 1 (white box; red-dotted line). (D) No changes in actin transcripts were detected between subgroups. (BD) Significant levels are shown (data ± SEM) as calculated using one-way ANOVA analysis (ns, not significant; * p ≤ 0.05; **** p ≤ 0.0001).
Figure 3
Figure 3
LECs synthesized transcripts specific for TGFβR1 and TGFβ isoforms. LECs were extracted and subjected to real-time RT-PCR. Differences between high myopia and myopia are shown for TGFβ-R (A), TGFβ1 (B), TGFβ2 (C), and TGFβ3 (D) and indicated by asterisks, as calculated using one-way ANOVA analysis. Note the significant increase in mRNAs specific for TGFβ-R (A) TGFβ1 (B) and TGFβ3 (D) in high myopia vs. emmetropia. Data are 2log-FC (fold changes, ±SEM), as calculated with respect to emmetropic eyes used as controls and referred to as 1 (white box). Red-dotted lines indicate the level of significance for relative PCR. Significant levels are shown as calculated using one-way ANOVA analysis (ns, not significant; * p ≤ 0.05; ** p ≤ 0.005; *** p ≤ 0.0005; **** p ≤ 0.0001).
Figure 4
Figure 4
LECs synthesize transcripts specific for IL-6 and IL-8 proteins and related receptors. LECs were analyzed for the specific amplification of IL-6 (A) and IL-8 (B) transcripts, and their specific IL-6R (C) and IL-8R (D) receptors were analyzed using relative real-time RT-PCR. A significant transcript expression was observed for IL-6 (A) and to a lesser extent for IL-8 (B). Of interest, no changes were quantified for IL-6RmRNA (C) with respect to IL-8RmRNA transcription that was significantly upregulated in high myopia (D). Data are 2log-FC (fold changes, ± SEM), as calculated with respect to emmetropic eyes used as controls and referred to as 1 (white box). Red-dotted lines indicate the level of significance for relative PCR. Significant levels are shown as calculated using one-way ANOVA analysis (p value summary: ns, not significant; * p ≤ 0.05; ** p ≤ 0.005; **** p ≤ 0.0001).
Figure 5
Figure 5
LECs synthesize transcripts specific for VEGF isoform proteins and related receptors. LEC samples were processed, and the specific amplification of VEGF isoform proteins (AC) and their specific VEGF-R1 (D), VEGF-R2 (E), and VEGF-R3 (F) receptor transcripts were analyzed using relative real-time RT-PCR. While slight changes were detected for VEGF-R1 (D), consistent transcript deregulation was observed for VEGF-R2 (E) and particularly VEGF-R3 (F) in myopia and high myopia. REST-ANOVA analysis was performed to obtain fold change (FC ± SEM) expression for each subgroup with respect to the emmetropic ones used as a control (herein referred as 1, white box). p-values are reported (ns, not significant; * p ≤ 0.05; ** p ≤ 0.005; *** p ≤ 0.0005; **** p ≤ 0.0001), as calculated using REST-ANOVA coupled analysis. Red-dotted lines indicate the level of significance for relative PCR.
Figure 6
Figure 6
Correlation between IL6 and VEGF pathways and α-SMA phenotype (EMT). Scatterplots representative of IL-6R, IL-6, VEGF-R1-14, and VEGF-A transcripts (2log, FC) plotted against α-SMA (2log, FC). The Pearson rho test showed that IL-6R and IL-6 positively and negatively with the contractile α-SMA transcript expression, respectively. On the contrary, no significant correlation was observed for VEGF-R1 and VEGF-A with respect to α-SMA expression. Correlation data (coefficient and p value) are shown in the plot.
Figure 7
Figure 7
AH circulation and the possible mechanisms behind the myopic AH signature and LEC differentiation. Schematic representation of the anterior chamber (the internal region between cornea and lens). Properly, AH is the result of blood flows entering the ciliary processes (diffusion), the pressure of plasma in the interstitium (ultrafiltration), and the active secretion of mediators by ciliary processes (secretion). AH circulates inside the anterior chamber (dark green lines). In our model, the inflammatory process of cataractogenesis (cloudy lens) and myopia (AL elongation) can influence the entire system, as supported by the presence of a plethora of proinflammatory and profibrogenic mediators. Double red arrows indicate the myopic AH that, in the context of a cloudy lens (cataract), can affect the two major cell monolayers: LECs and corneal endothelial cells. In this environment, LECs might differentiate in response to the AH profile (see a representative contractile EMT-LEC phenotype) or contribute to the AH signature (LEC and EMT-LEC transcription; see gray arrows). In our model, we cannot exclude the possibility that the AH protein signature might also affect corneal endothelial cells. Finally, the space between the cornea and iris, filled by AH (double arrows indicating fluid circulation), can communicate with the posterior chamber via the pupil (see dark green lines), contributing to an enrichment of the vitreal protein signature, as demonstrated in previous studies.

References

    1. Holden B.A., Fricke T.R., Wilson D.A., Jong M., Naidoo K.S., Sankaridurg P., Wong T.Y., Naduvilath T.J., Resnikoff S. Global Prevalence of Myopia and High Myopia and Temporal Trends from 2000 through 2050. Ophthalmology. 2016;123:1036–1042. doi: 10.1016/j.ophtha.2016.01.006. - DOI - PubMed
    1. Naidoo K.S., Fricke T.R., Frick K.D., Jong M., Naduvilath T.J., Resnikoff S., Sankaridurg P. Potential Lost Productivity Resulting from the Global Burden of Myopia: Systematic Review, Meta-analysis, and Modeling. Ophthalmology. 2019;126:338–346. doi: 10.1016/j.ophtha.2018.10.029. - DOI - PubMed
    1. Jiang L., Goh D.X., Koh J.H.Z., Chan X., Brennan N.A., Barathi V.A., Hoang Q.V. Applications of Genomics and Transcriptomics in Precision Medicine for Myopia Control or Prevention. Biomolecules. 2023;13:494. doi: 10.3390/biom13030494. - DOI - PMC - PubMed
    1. Wen K., Zhang L., Cai Y., Teng H., Liang J., Yue Y., Li Y., Huang Y., Liu M., Zhang Y., et al. Identification and characterization of extrachromosomal circular DNA in patients with high myopia and cataract. Epigenetics. 2023;18:2192324. doi: 10.1080/15592294.2023.2192324. - DOI - PMC - PubMed
    1. Tedja M.S., Haarman A.E., Meester-Smoor M.A., Kaprio J., Mackey D.A., Guggenheim J.A., Hammond C.J., Verhoeven V.J., Klaver C.C., CREAM Consortium Myopia Genetics Report. Investig. Ophthalmol. Vis. Sci. 2019;60:M89–M105. doi: 10.1167/iovs.18-25965. - DOI - PMC - PubMed

Publication types

Supplementary concepts

LinkOut - more resources