. 2023 Aug 31;13(9):1333.
doi: 10.3390/biom13091333.

ABCD1 Transporter Deficiency Results in Altered Cholesterol Homeostasis

Affiliations

ABCD1 Transporter Deficiency Results in Altered Cholesterol Homeostasis

Agnieszka Buda et al. Biomolecules. .

Abstract

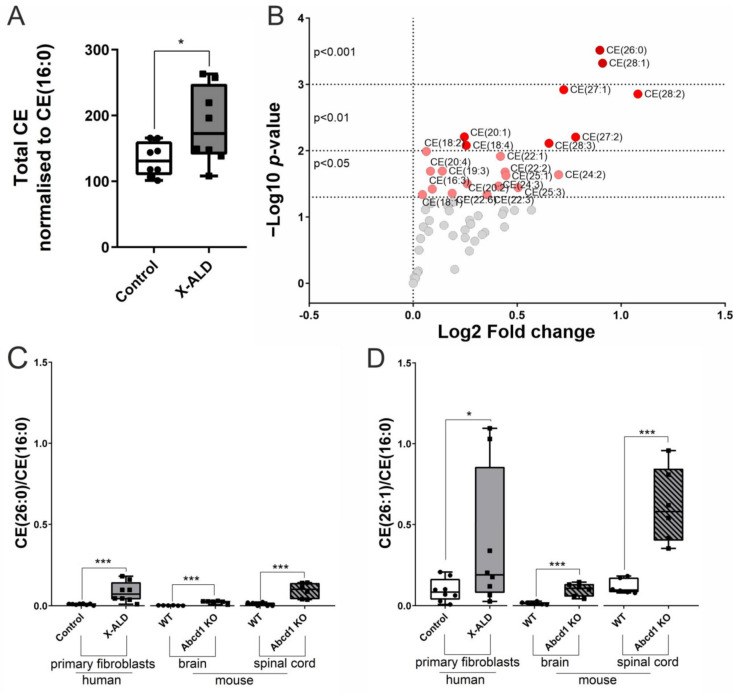
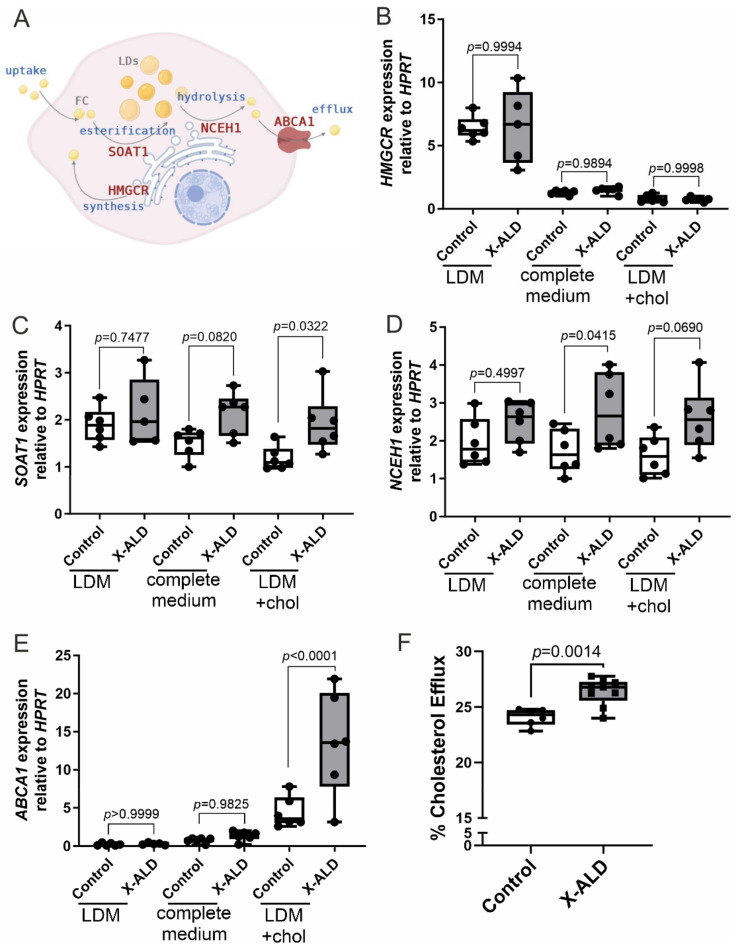
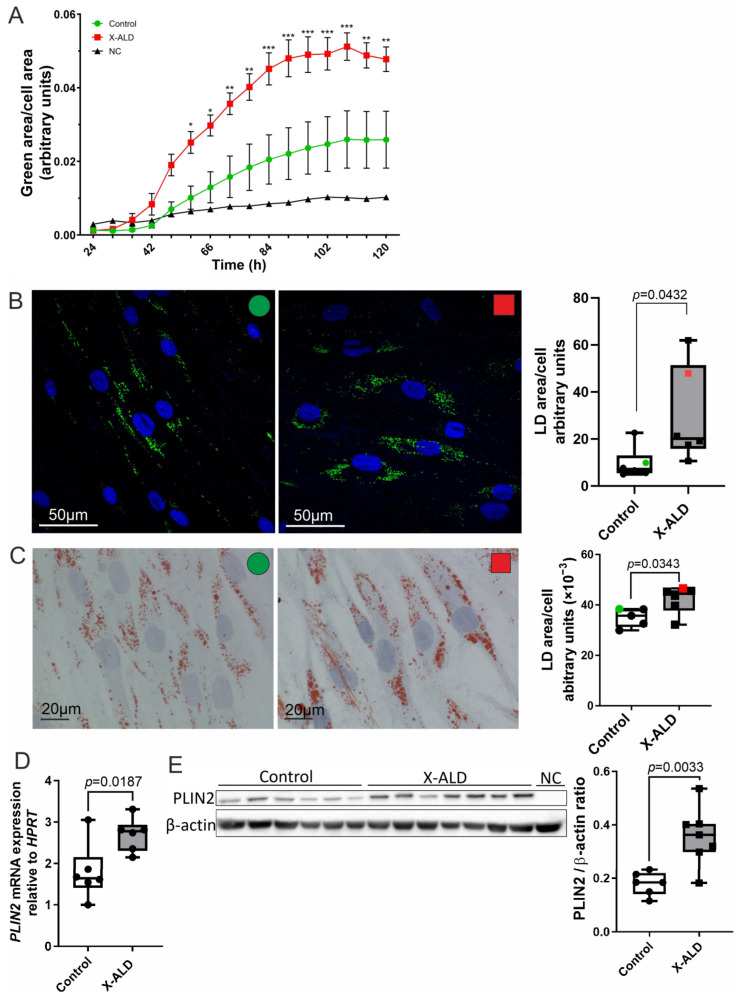
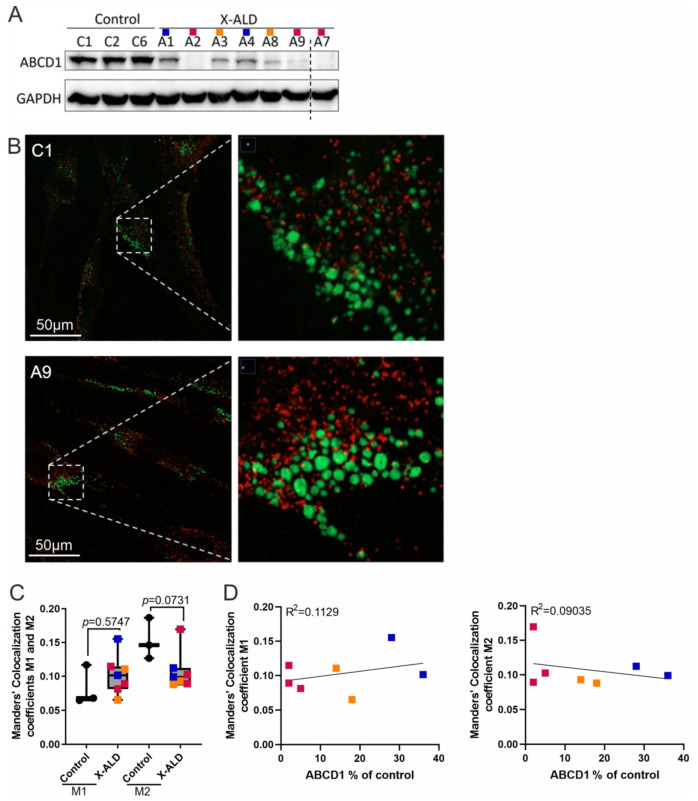
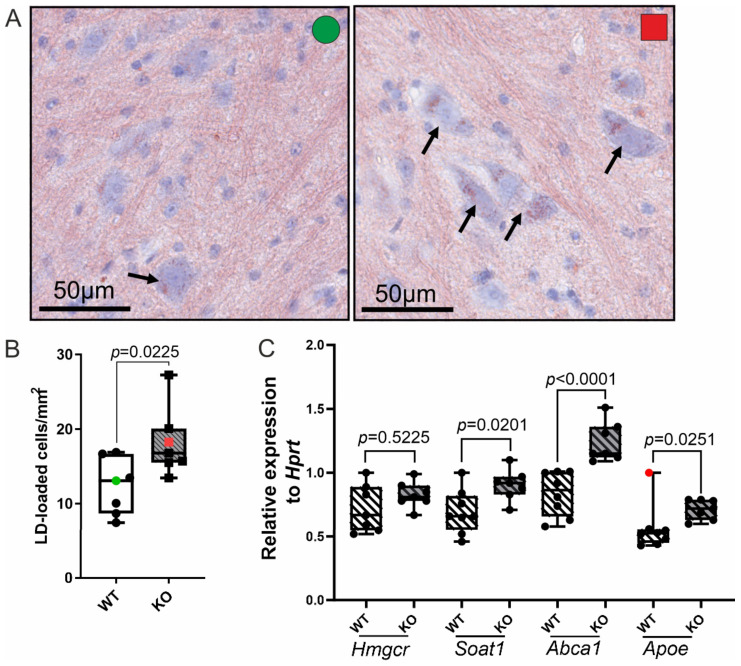
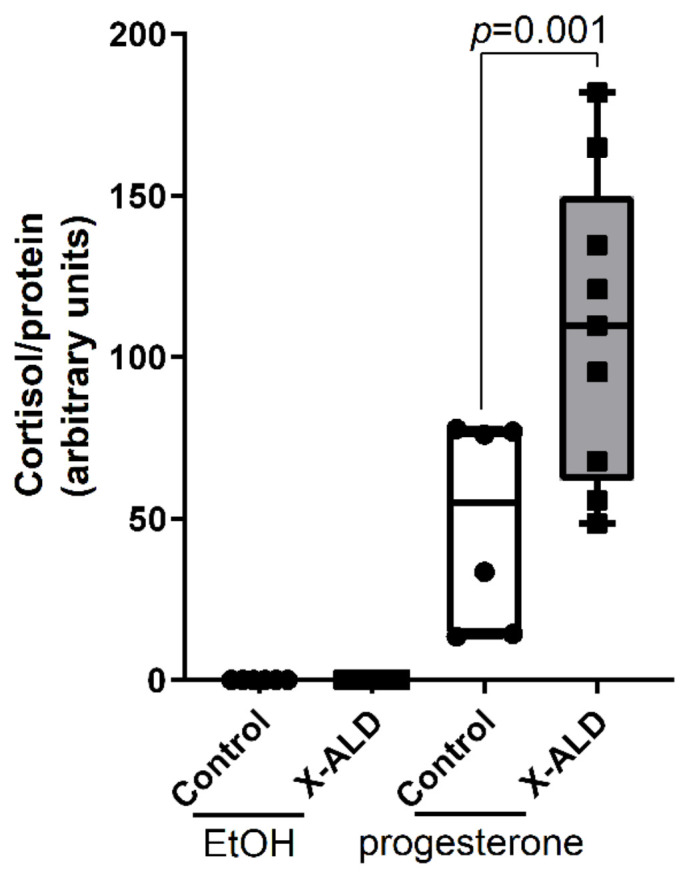
X-linked adrenoleukodystrophy (X-ALD), the most common peroxisomal disorder, is caused by mutations in the peroxisomal transporter ABCD1, resulting in the accumulation of very long-chain fatty acids (VLCFA). Strongly affected cell types, such as oligodendrocytes, adrenocortical cells and macrophages, exhibit high cholesterol turnover. Here, we investigated how ABCD1 deficiency affects cholesterol metabolism in human X-ALD patient-derived fibroblasts and CNS tissues of Abcd1-deficient mice. Lipidome analyses revealed increased levels of cholesterol esters (CE), containing both saturated VLCFA and mono/polyunsaturated (V)LCFA. The elevated CE(26:0) and CE(26:1) levels remained unchanged in LXR agonist-treated Abcd1 KO mice despite reduced total C26:0. Under high-cholesterol loading, gene expression of SOAT1, converting cholesterol to CE and lipid droplet formation were increased in human X-ALD fibroblasts versus healthy control fibroblasts. However, the expression of NCEH1, catalysing CE hydrolysis and the cholesterol transporter ABCA1 and cholesterol efflux were also upregulated. Elevated Soat1 and Abca1 expression and lipid droplet content were confirmed in the spinal cord of X-ALD mice, where expression of the CNS cholesterol transporter Apoe was also elevated. The extent of peroxisome-lipid droplet co-localisation appeared low and was not impaired by ABCD1-deficiency in cholesterol-loaded primary fibroblasts. Finally, addressing steroidogenesis, progesterone-induced cortisol release was amplified in X-ALD fibroblasts. These results link VLCFA to cholesterol homeostasis and justify further consideration of therapeutic approaches towards reducing VLCFA and cholesterol levels in X-ALD.

Keywords: ABCD1; Abcd1 KO mice; VLCFA; X-linked adrenoleukodystrophy; cholesterol esters; cortisol; lipid droplets; lipid metabolism; lipidomics.


Conflict of interest statement

The authors declare no conflict of interest.

Figures

Figure 1
Figure 1
Cholesterol ester-fatty acid species are increased in primary human X-ALD fibroblasts and in the CNS of Abcd1 KO mice. (AD) Lipidomic analyses were performed on control and X-ALD fibroblasts (n = 8 each) and on the brain and spinal cord of WT and Abcd1 KO mice (n = 6 each) using ultrahigh resolution liquid chromatography-mass spectrometry. The comparisons of total cellular cholesterol ester (CE) content (A) and CE-fatty acid composition (B) of control and X-ALD fibroblasts are displayed as a boxplot and volcano plot, respectively. The accumulation of CE-VLCFA species, represented by CE(26:0) in (C) and CE(26:1) in (D), was determined in human fibroblasts and murine CNS tissues and displayed as boxplots. All CE and CE(FA) levels were normalised to CE(16:0). Unpaired two-sided Student’s t-test was performed in (A). For (BD), Qlucore Omics Explorer 3.5 software was used to analyse the lipidomic data statistically by conducting a two-group comparison test. The obtained p-values and log2-fold change values were used to create a volcano plot. The box plots (in (A,C,D)) show all the individual values and the median. * p < 0.05; *** p < 0.001.
Figure 2
Figure 2
Imbalanced cholesterol homeostasis in X-ALD-derived fibroblasts leads to increased cholesterol efflux upon prolonged cholesterol loading. (A) Simplified schematic representation of cellular cholesterol turnover (FC, free cholesterol; LDs, lipid droplets). (BE) Primary human control or X-ALD-derived fibroblasts (n = 6 each) were cultured for 5 days in lipid-depleted medium (LDM), RPMI with FBS (complete medium) or LDM supplemented with 10 μg/mL cholesterol (LDM + chol). RT-qPCR was carried out to determine the relative mRNA levels (normalised to HPRT1) of genes involved in cholesterol synthesis, HMGCR (B); cholesterol esterification, SOAT1 (C); cholesterol ester hydrolysis, NCEH1 (D); and cholesterol export, ABCA1 (E). (F) Cholesterol efflux was measured after 5 days of loading cholesterol in LDM + chol (control, n = 6; X-ALD, n = 9). The box plots in (BF) show all individual values and the median. One-way ANOVA with Sidak’s multiple comparisons test was performed for statistical analysis of the data in (BE). Unpaired two-sided Student’s t-test was performed in (F). The image in (A) was created using BioRender.com.
Figure 3
Figure 3
Increased lipid droplet induction upon prolonged cholesterol loading in X-ALD vs. control fibroblasts. (AE) Control and X-ALD-derived primary fibroblasts were starved for 72 h in LDM and then incubated for 5 days with 10 or 20 µg/mL cholesterol in LDM. (A) The time course of LD formation induced by 20 µg/mL cholesterol treatment was monitored in four cell lines/genotype using the neutral lipid stain, BODIPY™ 493/503, and Incucyte® live-cell imaging. Cells were recorded from 24 h through to 120 h after adding cholesterol. The results are expressed as the fraction green fluorescence area/cell area. NC, normal control fibroblast line in LDM with 2% ethanol and BODIPY™ 493/503. The data are depicted as mean ± SD. Two-way ANOVA with Dunnett’s multiple comparisons test: * p < 0.05; ** p < 0.01; *** p < 0.001. (BE) Fibroblasts (n = 6 per genotype) were exposed to 10 µg/mL cholesterol for 5 days before analysis. Representative confocal microscopy pictures (B) of control (left panel, green dot) and X-ALD (middle panel, red square) cells stained with BODIPY™ 493/503 (LDs, green fluorescence) and DAPI (nuclei, blue). Light microscopy pictures (C) of control and X-ALD cells stained with Oil Red O and haematoxylin. Images in (B,C) were analysed using ImageJ software and the results were expressed as LD area/cell (right panels). The microscopy views correspond to the colour-coded samples in the graphs. (D) Relative Perilipin 2 (PLIN2) mRNA levels, normalised to HPRT1, determined by RT-qPCR. (E) PLIN2 protein expression normalised to β-actin was assessed by western blot analysis: Original images could be found in Supplementary File—original-images. (E). In (BE), the box plots show individual data points and the median; statistically significant differences determined using unpaired two-sided Student’s t-test are displayed as exact p-values.
Figure 4
Figure 4
Low interaction between peroxisomes and lipid droplets under cholesterol-loading conditions in both control and X-ALD fibroblasts. (A) Western blot analysis depicting various levels of stable ABCD1 protein and GAPDH for normalisation of loading in the cell lines used for the co-localisation study in standard RPMI medium. The samples are colour-coded according to their ABCD1 content (blue, >20%; orange, 5–20%; red, <5%). A cut in the image is indicated by a dashed line; for the full set and quantification of ABCD1 protein levels, see Supplementary Figure S7. (BD) Control (n = 3) and X-ALD-derived fibroblasts (n = 7) were starved in LDM, loaded with 20 µg/mL cholesterol for 72 h and stained with BODIPY™ 493/503 (for LDs) and anti-PMP70 antibody (for peroxisomes). Representative ultra-high resolution confocal images of LDs (green) and peroxisomes (red) and their interactions (yellow) in cholesterol-treated cells (control C1 and X-ALD A9) Original images could be found in Supplementary File—original-images (B). The extent of interaction between LDs and peroxisomes is expressed as Manders’ co-localisation coefficients, M1 (% of green pixel with red component) and M2 (% of red pixel with green component) (C), one-way ANOVA with Sidak’s multiple comparisons test. Linear regression analysis of the relationship between M1 or M2 and the level of mutated ABCD1 protein in X-ALD cells revealed no significant correlation (D).
Figure 5
Figure 5
Dysregulation of the cholesterol-related gene expression and increased numbers of LD-positive neurons in the spinal cord Abcd1 KO mice. (AC) Spinal cord tissue was dissected from 12-month-old WT or Abcd1 KO mice (n = 7 each) for RNA extraction or cryosectioning and Oil Red O (ORO) staining of LDs. Representative light microscopy views from the ventral horn of ORO-stained WT (green circle) and Abcd1 KO (red square) lumbar spinal cord, counterstained with haematoxylin (blue cell nuclei and, in neurons, rough ER) (A) show the somas of several motor neurons with LDs (black arrows). For quantification of neutral lipid accumulation, the number of LD-loaded motor neurons was normalised to the tissue area (ventral horn grey matter) (B). The coloured data points correspond to the samples shown in (A). The relative mRNA levels of the cholesterol-related genes: Hmgcr (synthesis), Soat1 (esterification), Abca1 and Apoe (export), and for normalisation, Hprt, were determined by RT-qPCR (C). The box plots display all individual values and the median. The red dot indicates an extreme outlier (>3 × IQR), excluded from the statistical analysis. The unpaired two-sided Student’s t-test in was performed in (B) and one-way ANOVA with Sidak’s multiple comparisons test in (C).
Figure 6
Figure 6
X-ALD fibroblasts release higher amounts of cortisol upon stimulation with progesterone. Control (n = 6) or X-ALD (n = 10) fibroblasts were treated with vehicle (EtOH) or 1 μM progesterone for 24 h. Cortisol levels were measured in the supernatants using Luminex xMAP technology and normalised to the protein content of the harvested cells. The results are presented as box plots showing all values and the medians. Data were analysed by conducting one-way ANOVA with Sidak’s multiple comparisons test.

Similar articles

Cited by

References

    1. Bezman L., Moser A.B., Raymond G.V., Rinaldo P., Watkins P.A., Smith K.D., Kass N.E., Moser H.W. Adrenoleukodystrophy: Incidence, new mutation rate, and results of extended family screening. Ann. Neurol. 2001;49:512–517. doi: 10.1002/ana.101. - DOI - PubMed
    1. Moser A.B., Jones R.O., Hubbard W.C., Tortorelli S., Orsini J.J., Caggana M., Vogel B.H., Raymond G.V. Newborn screening for X-Linked adrenoleukodystrophy. Int. J. Neonatal Screen. 2016;2:15. doi: 10.3390/ijns2040015. - DOI - PMC - PubMed
    1. Kemp S., Pujol A., Waterham H.R., Van Geel B.M., Boehm C.D., Raymond G.V., Cutting G.R., Wanders R.J.A., Moser H.W. ABCD1 mutations and the X-linked adrenoleukodystrophy mutation database: Role in diagnosis and clinical correlations. Hum. Mutat. 2001;18:499–515. doi: 10.1002/humu.1227. - DOI - PubMed
    1. Wiesinger C., Kunze M., Regelsberger G., Forss-Petter S., Berger J. Impaired very long-chain acyl-CoA β-oxidation in human X-linked adrenoleukodystrophy fibroblasts is a direct consequence of ABCD1 transporter dysfunction. J. Biol. Chem. 2013;288:19269–19279. doi: 10.1074/jbc.M112.445445. - DOI - PMC - PubMed
    1. Kihara A. Very long-chain fatty acids: Elongation, physiology and related disorders. J. Biochem. 2012;152:387–395. doi: 10.1093/jb/mvs105. - DOI - PubMed

Publication types

MeSH terms

Substances

LinkOut - more resources