. 2023 Aug 23;13(9):1233.
doi: 10.3390/brainsci13091233.

Real and Deepfake Face Recognition: An EEG Study on Cognitive and Emotive Implications

Affiliations

Real and Deepfake Face Recognition: An EEG Study on Cognitive and Emotive Implications

Pietro Tarchi et al. Brain Sci. .

Abstract

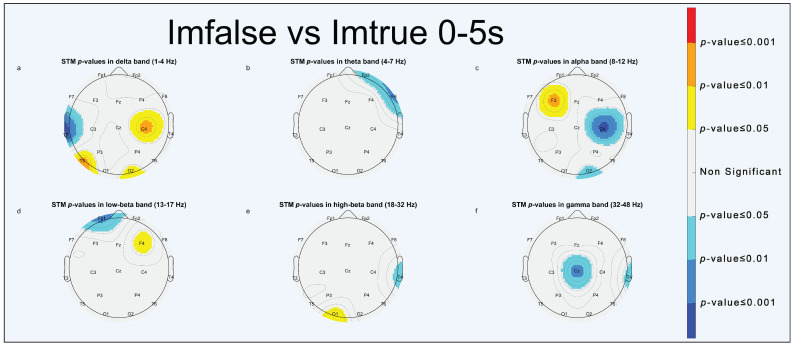
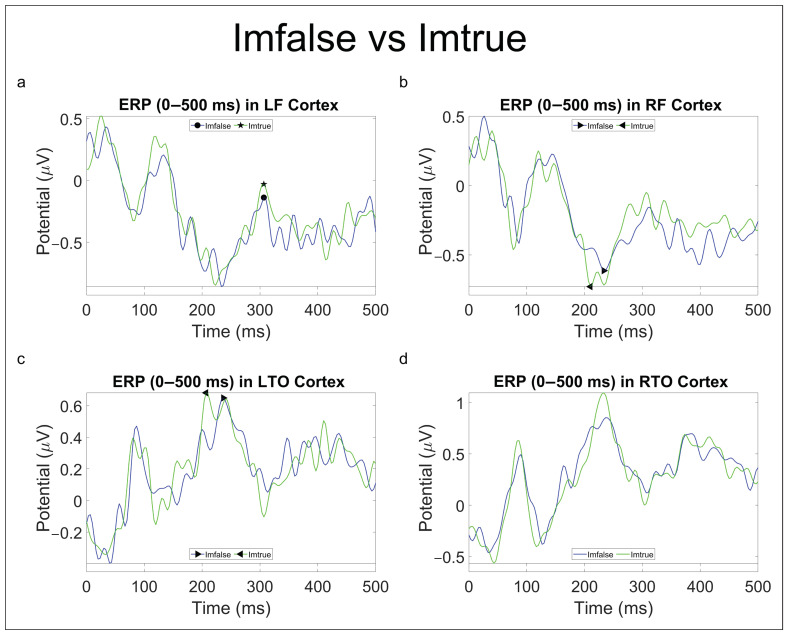
The human brain's role in face processing (FP) and decision making for social interactions depends on recognizing faces accurately. However, the prevalence of deepfakes, AI-generated images, poses challenges in discerning real from synthetic identities. This study investigated healthy individuals' cognitive and emotional engagement in a visual discrimination task involving real and deepfake human faces expressing positive, negative, or neutral emotions. Electroencephalographic (EEG) data were collected from 23 healthy participants using a 21-channel dry-EEG headset; power spectrum and event-related potential (ERP) analyses were performed. Results revealed statistically significant activations in specific brain areas depending on the authenticity and emotional content of the stimuli. Power spectrum analysis highlighted a right-hemisphere predominance in theta, alpha, high-beta, and gamma bands for real faces, while deepfakes mainly affected the frontal and occipital areas in the delta band. ERP analysis hinted at the possibility of discriminating between real and synthetic faces, as N250 (200-300 ms after stimulus onset) peak latency decreased when observing real faces in the right frontal (LF) and left temporo-occipital (LTO) areas, but also within emotions, as P100 (90-140 ms) peak amplitude was found higher in the right temporo-occipital (RTO) area for happy faces with respect to neutral and sad ones.

Keywords: deepfakes; emotions; event-related potentials (ERPs); face recognition; power spectrum.


Conflict of interest statement

The authors declare no conflict of interest.

Figures

Figure 1
Figure 1
Experimental protocol timeline.
Figure 2
Figure 2
Example of synthetic (a,c,e) and real (b,d,f) faces expressing positive (a,b), neutral (c,d), and negative emotions (e,f) used as stimuli.
Figure 3
Figure 3
Example of EEG data from P3 channel before (a,c,e) and after (b,d,f) performing HAPPE.
Figure 4
Figure 4
STMs of significant statistical activation of brain areas for “Imfalse vs. Imtrue” comparison (0–5 s). (a) delta band, (b) theta band, (c) alpha band, (d) low-beta band, (e) high-beta band, (f) gamma band.
Figure 5
Figure 5
STMs of significant statistical activation of brain areas for “Imfalse vs. Imtrue” comparison (5–10 s). (a) delta band, (b) theta band, (c) alpha band, (d) low-beta band, (e) high-beta band, (f) gamma band.
Figure 6
Figure 6
STMs of significant statistical activation of brain areas for “Imfalse vs. Imtrue” comparison (0–10 s). (a) delta band, (b) theta band, (c) alpha band, (d) low-beta band, (e) high-beta band, (f) gamma band.
Figure 7
Figure 7
STMs of significant statistical activation of brain areas in emotional comparisons (0–10 s). “Happy vs. Neutral” comparison (af): (a) delta band, (b) theta band, (c) alpha band, (d) low-beta band, (e) high-beta band, (f) gamma band. “Happy vs. Sad” comparison (gl): (g) delta band, (h) theta band, (i) alpha band, (j) low-beta band, (k) high-beta band, (l) gamma band. “Neutral vs. Sad” comparison (mr): (m) delta band, (n) theta band, (o) alpha band, (p) low-beta band, (q) high-beta band, (r) gamma band.
Figure 8
Figure 8
ERP (0–500 ms) in LF (a), RF (b), LTO (c), and RTO (d) areas for “Imfalse vs. Imtrue” comparison. Significant p-values (p<0.05) for peaks amplitude are reported with the ★ (indicating prevalence) and ● symbols, whereas for peaks latency, they are reported with the ◂ (indicating prevalence) and ▸ symbols.
Figure 9
Figure 9
Boxplots of amplitude distributions in LF area (a) for P300 component and latency distributions for N250 component in RF (b) and LTO (c) areas for “Imfalse vs. Imtrue” comparison.
Figure 10
Figure 10
ERP (0–500 ms) in LF (a), RF (b), LTO (c), and RTO (d) areas for “Happy vs. Neutral” comparison. Significant p-values (p<0.05) for peak amplitude are reported with the ★ (indicating prevalence) and • symbols.
Figure 11
Figure 11
ERP (0–500 ms) in LF (a), RF (b), LTO (c), and RTO (d) areas for “Happy vs. Sad” comparison. Significant p-values (p<0.05) for peak amplitude are reported with the ★ (indicating prevalence) and • symbols.

Similar articles

References

    1. Pascalis O., Kelly D.J. On the development of face processing. Perspect. Psychol. Sci. 2009;4:200–209. doi: 10.1111/j.1745-6924.2009.01119.x. - DOI - PubMed
    1. Jackson M.C., Raymond J.E. The role of attention and familiarity in face identification. Percept. Psychophys. 2006;68:543–557. doi: 10.3758/BF03208757. - DOI - PubMed
    1. Kanwisher N., Yovel G. The fusiform face area: A cortical region specialized for the perception of faces. Philos. Trans. R. Soc. B Biol. Sci. 2006;361:2109–2128. doi: 10.1098/rstb.2006.1934. - DOI - PMC - PubMed
    1. Babo-Rebelo M., Puce A., Bullock D., Hugueville L., Pestilli F., Adam C., Lehongre K., Lambrecq V., Dinkelacker V., George N. Visual information routes in the posterior dorsal and ventral face network studied with intracranial neurophysiology and white matter tract endpoints. Cereb. Cortex. 2022;32:342–366. doi: 10.1093/cercor/bhab212. - DOI - PMC - PubMed
    1. Haxby J.V., Hoffman E.A., Gobbini M.I. The distributed human neural system for face perception. Trends Cogn. Sci. 2000;4:223–233. doi: 10.1016/S1364-6613(00)01482-0. - DOI - PubMed

LinkOut - more resources