. 2023 Aug 25;13(9):1242.
doi: 10.3390/brainsci13091242.

Time-Dependent Analysis of Human Neurophysiological Activities during an Ecological Olfactory Experience

Affiliations

Time-Dependent Analysis of Human Neurophysiological Activities during an Ecological Olfactory Experience

Alessia Vozzi et al. Brain Sci. .

Abstract

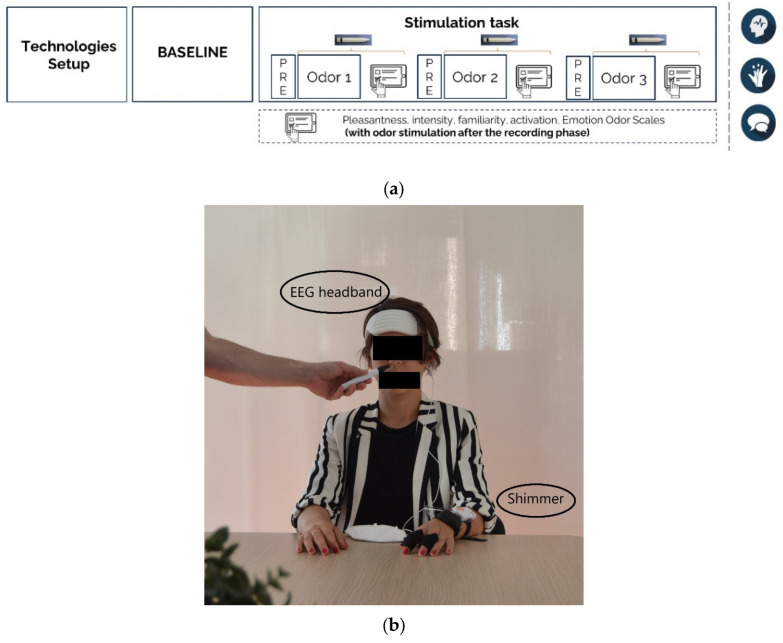
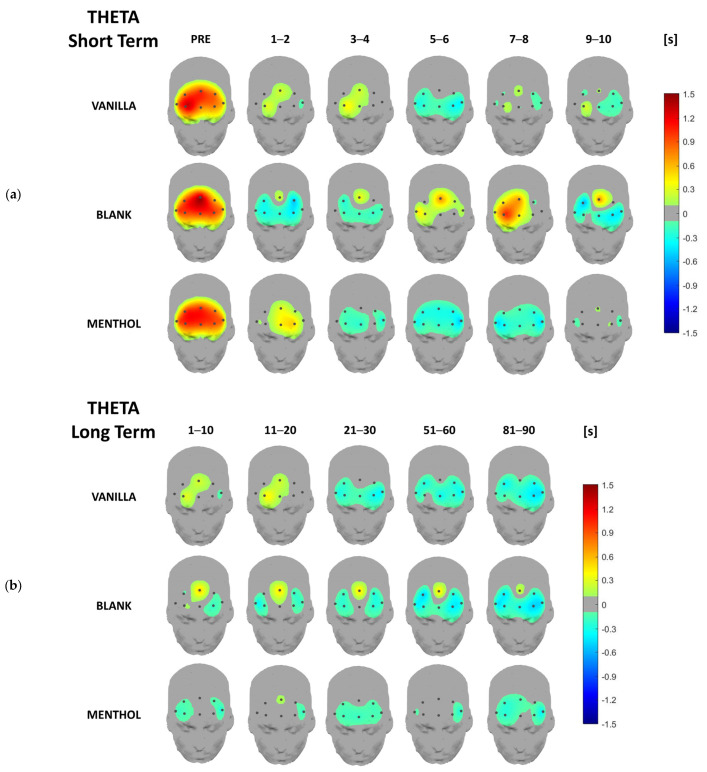
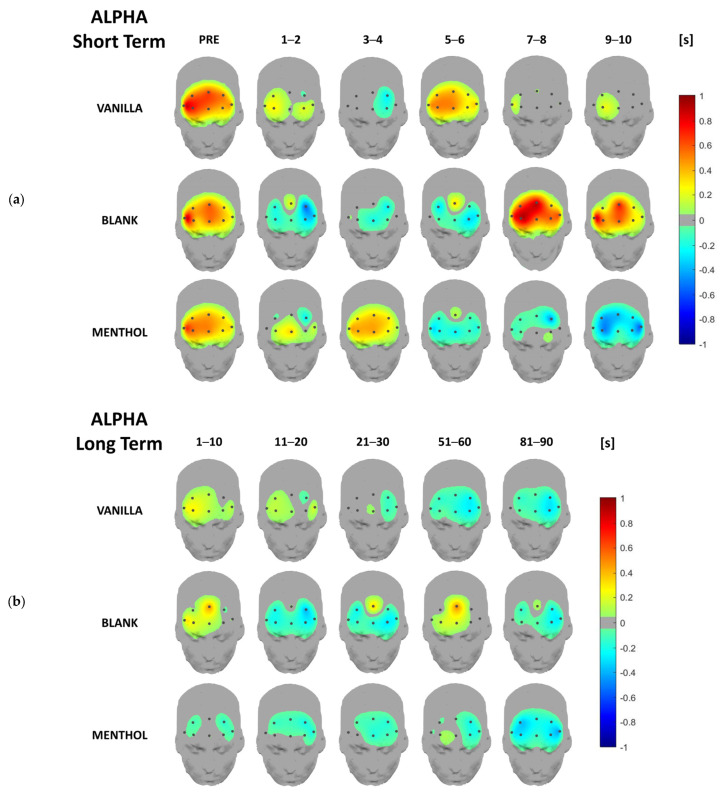
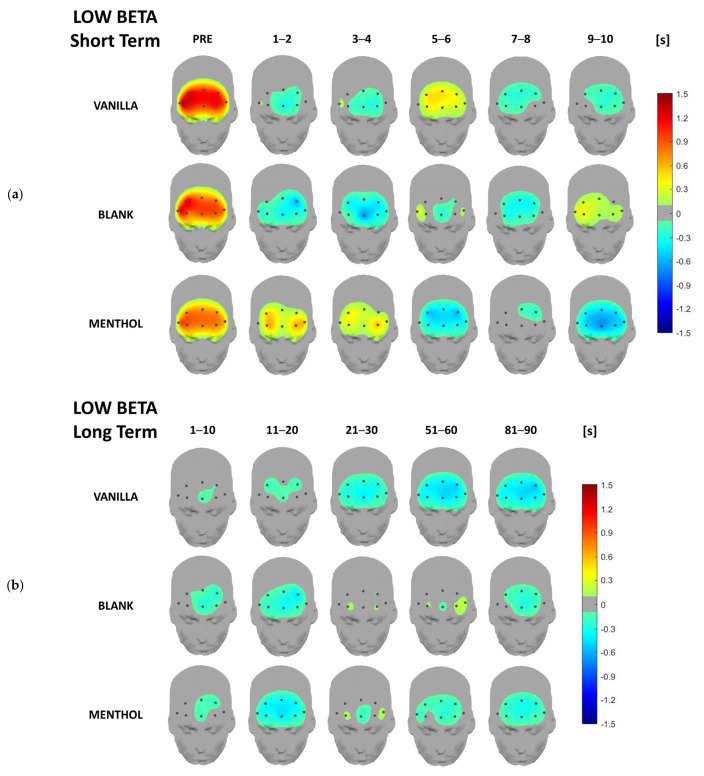
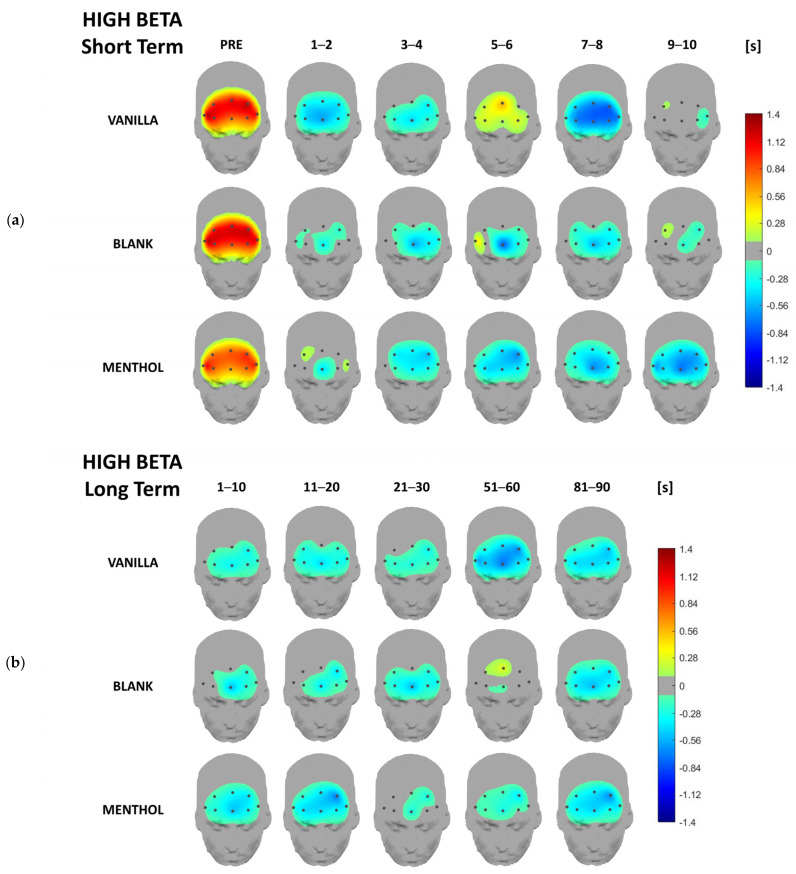
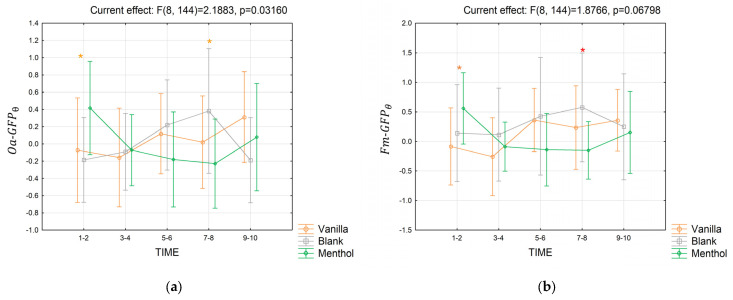
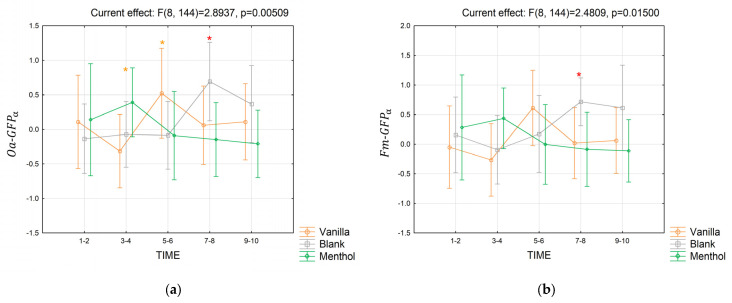
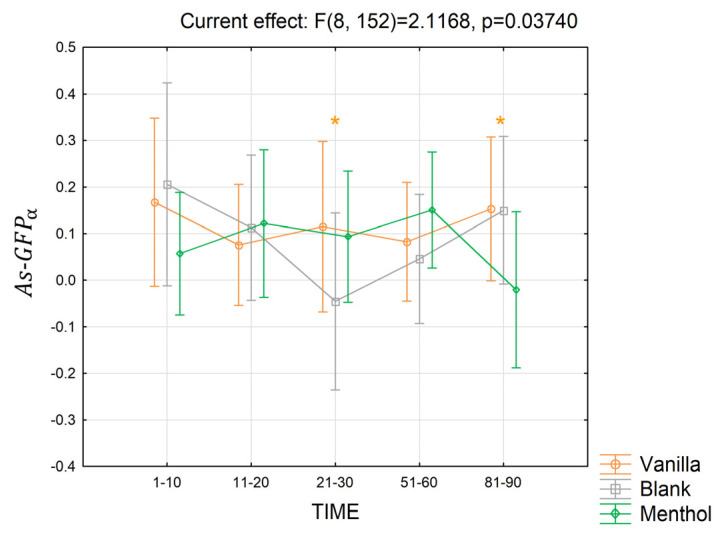
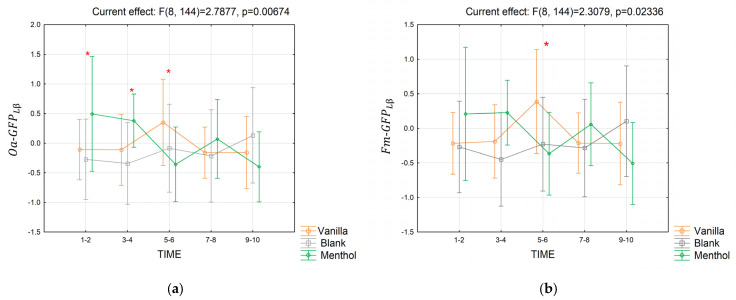
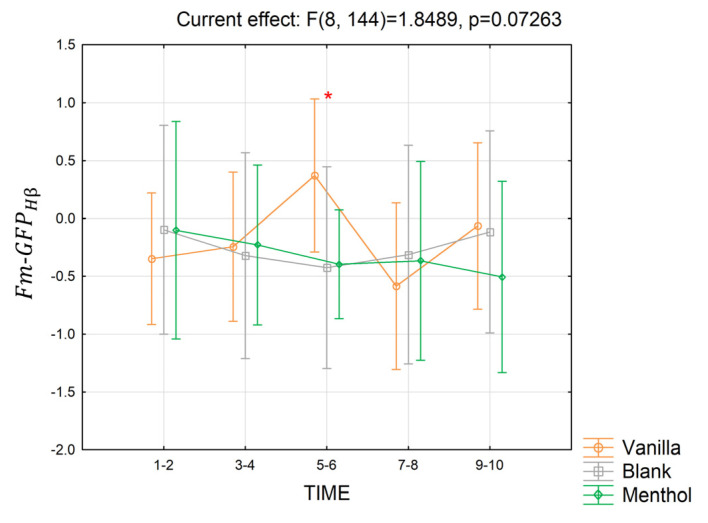
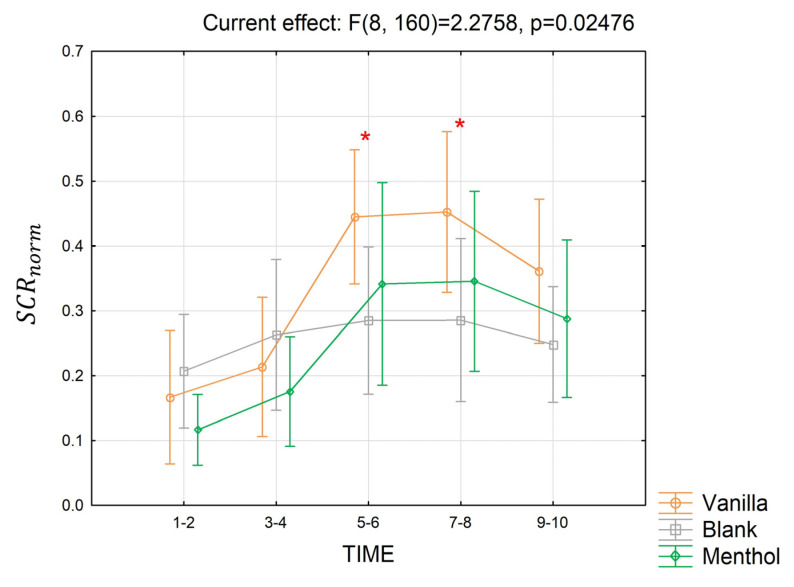
It has been demonstrated that odors could affect humans at the psychophysiological level. Significant research has been done on odor perception and physiological mechanisms; however, this research was mainly performed in highly controlled conditions in order to highlight the perceptive phenomena and the correlated physiological responses in the time frame of milliseconds. The present study explored how human physiological activity evolves in response to different odor conditions during an ecological olfactory experience on a broader time scale (from 1 to 90 s). Two odors, vanilla and menthol, together with a control condition (blank) were employed as stimuli. Electroencephalographic (EEG) activity in four frequency bands of interest, theta, alpha, low beta, and high beta, and the electrodermal activity (EDA) of the skin conductance level and response (SCL and SCR) were investigated at five time points taken during: (i) the first ten seconds of exposure (short-term analysis) and (ii) throughout the entire exposure to each odor (90 s, long-term analysis). The results revealed significant interactions between the odor conditions and the time periods in the short-term analysis for the overall frontal activity in the theta (p = 0.03), alpha (p = 0.005), and low beta (p = 0.0067) bands, the frontal midline activity in the alpha (p = 0.015) and low beta (p = 0.02) bands, and the SCR component (p = 0.024). For the long-term effects, instead, only one EEG parameter, frontal alpha asymmetry, was significantly sensitive to the considered dimensions (p = 0.037). In conclusion, the present research determined the physiological response to different odor conditions, also demonstrating the sensitivity of the employed parameters in characterizing the dynamic of such response during the time. As an exploratory study, this work points out the relevance of considering the effects of continuous exposure instead of short stimulation when evaluating the human olfactory experience, providing insights for future studies in the field.

Keywords: EDA; EEG; olfactory stimulation; physiological signals; signal processing.


Conflict of interest statement

The authors declare no conflict of interest.

Figures

Figure 1
Figure 1
The experimental protocol. (a) The steps of the protocol. (b) Picture taken during the task.
Figure 2
Figure 2
The average VAS scores for the four explored dimensions: pleasantness (a), intensity (b), familiarity (c), and relaxation, and (d) for the three odor conditions: vanilla, blank, and menthol. “**” indicates when the VAS values are significantly different from the others, with p < 0.01.
Figure 3
Figure 3
The average EOS scores for the two considered emotions, the energy (a) and soothing (b) dimensions, for the three odor conditions: vanilla, menthol, and blank. “**” indicates when the VAS values are significantly different from the others, with p < 0.01.
Figure 4
Figure 4
Headplots representing the theta power distribution in the short-term (a) and long-term (b), averaged over the whole sample for the three stimulations and the different time segments.
Figure 5
Figure 5
Headplots representing the alpha power distribution in the short-term (a) and long-term (b), averaged over the whole sample for the three stimulations and the different time segments.
Figure 6
Figure 6
Headplots representing the low beta power distribution in the short-term (a) and long-term (b), averaged over the whole sample for the three stimulations and the different time segments.
Figure 7
Figure 7
Headplots representing the high-beta power distribution in the short-term (a) and long-term (b) averaged over the whole sample for the three stimulations and the different time segments.
Figure 8
Figure 8
The trends in the OaGFPθ (a) and FmGFPθ (b) indices for the three odor conditions in the short-term. Vertical bars denote 0.95 confidence intervals. Red “*” indicates when the index for a considered time segment is significantly different for an odor condition compared to the others, with p ≤ 0.05. “*” is colored in orange when 0.05 < p ≤ 0.09.
Figure 9
Figure 9
The trend in the OaGFPα (a) and FmGFPα (b) indices for the three odor conditions in the short-term. Vertical bars denote 0.95 confidence intervals. Red “*” indicates when the index for a considered time segment is significantly different for an odor condition compared to the others, with p ≤ 0.05. “*” is colored in orange when 0.05 < p ≤ 0.09.
Figure 10
Figure 10
The trend in the AsGFPα for the three odor conditions in the long-term. Vertical bars denote 0.95 confidence intervals. “*” is colored in orange when 0.05 < p ≤ 0.09.
Figure 11
Figure 11
The trend in the OaGFPLβ (a) and FmGFPLβ (b) indices for the three odor conditions in the short-term. Vertical bars denote 0.95 confidence intervals. Red “*” indicates when the index for a considered time segment is significantly different for an odor condition compared to the others, with p ≤ 0.05.
Figure 12
Figure 12
The trend in the FmGFPHβ index for the three odor conditions in the short-term. Vertical bars denote 0.95 confidence intervals. Red “*” indicates when the index for a considered time segment is significantly different for an odor condition compared to the others, with p ≤ 0.05.
Figure 13
Figure 13
The trend in the SCRnorm index for the three odor conditions in the short-term. Vertical bars denote 0.95 confidence intervals. Red “*” indicates when the index for a considered time segment is significantly different for an odor condition compared to the others, with p ≤ 0.05.

Similar articles

Cited by

References

    1. Tang Y., Gong M., Qin X., Su H., Wang Z., Dong H. The Therapeutic Effect of Aromatherapy on Insomnia: A Meta-Analysis. J. Affect. Disord. 2021;288:1–9. doi: 10.1016/j.jad.2021.03.066. - DOI - PubMed
    1. Almohammed H.I., Alanazi N.A., Maghrabi E.F., Alotaibi M.A. Role of Aromatherapy as a Natural Complementary and Alternative Therapy in Cardiovascular Disease: A Comprehensive Systematic Review. Evid.-Based Complement. Altern. Med. 2022;2022:4543078. doi: 10.1155/2022/4543078. - DOI - PMC - PubMed
    1. Ji X., Ivers H., Beaulieu-Bonneau S., Morin C.M. Complementary and alternative treatments for insomnia/insomnia—Depression-anxiety symptom cluster: Meta-analysis of English and Chinese literature. Sleep Med. Rev. 2021;58:101445. doi: 10.1016/j.smrv.2021.101445. - DOI - PubMed
    1. Mancini M., Cherubino P., Cartocci G., Martinez A., Borghini G., Guastamacchia E., Di Flumeri G., Rossi D., Modica E., Menicocci S., et al. Forefront Users’ Experience Evaluation by Employing Together Virtual Reality and Electroencephalography: A Case Study on Cognitive Effects of Scents. Brain Sci. 2021;11:256. doi: 10.3390/brainsci11020256. - DOI - PMC - PubMed
    1. David O.A., David D.O., Mogoase C., Popescu L.C., Giosan C., Pellegrino A. Psychological effects and brain correlates of a rose-based scented cosmetic cream. J. Sens. Stud. 2019;34:e12536. doi: 10.1111/joss.12536. - DOI