. 2023 Aug 22;12(9):1655.
doi: 10.3390/antiox12091655.

Nitric Oxide Induces Autophagy in Triticum aestivum Roots

Affiliations

Nitric Oxide Induces Autophagy in Triticum aestivum Roots

Farida Minibayeva et al. Antioxidants (Basel). .

Abstract

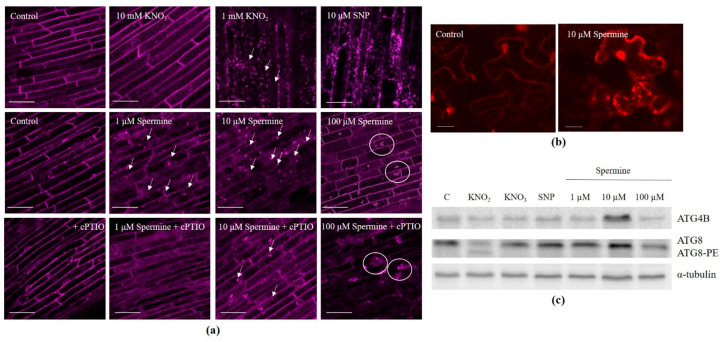
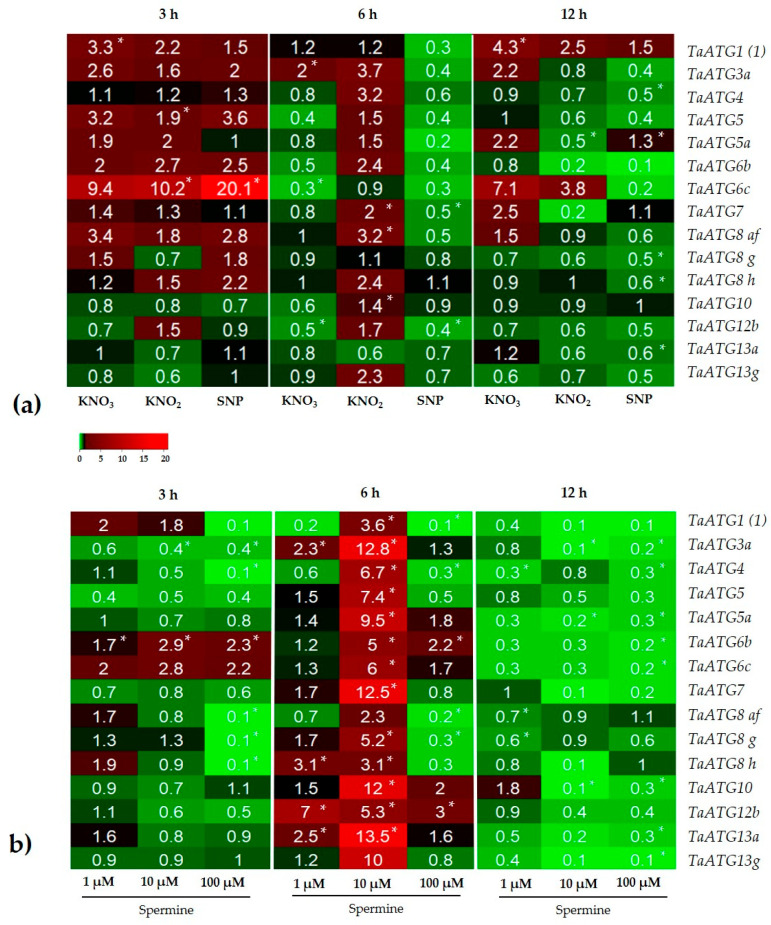
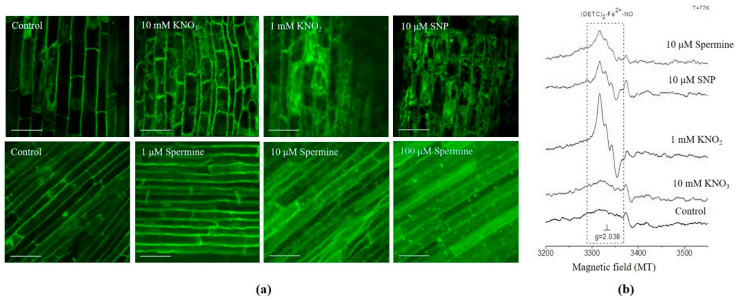
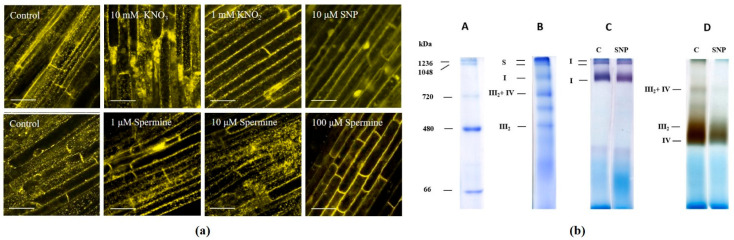
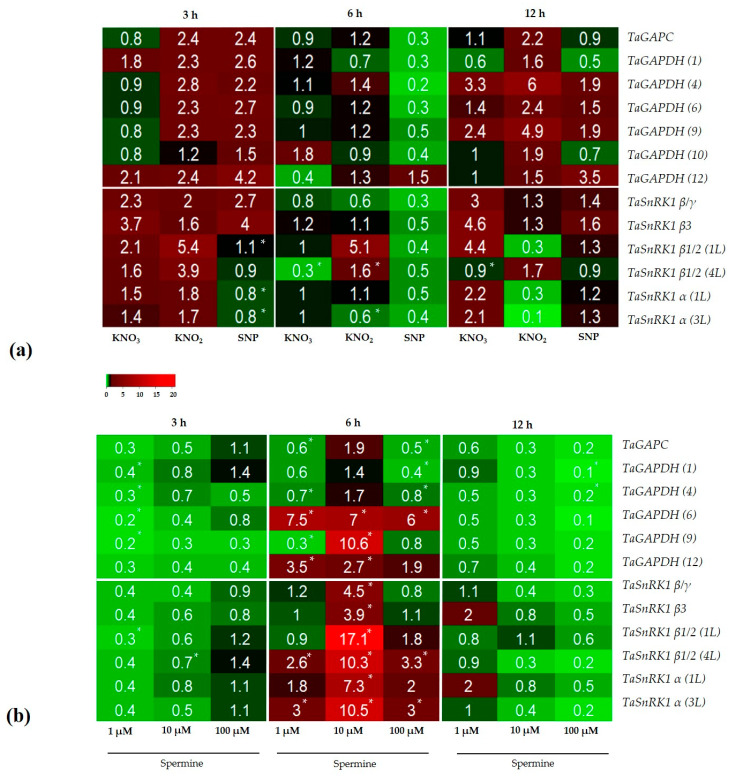
Autophagy is a highly conserved process that degrades damaged macromolecules and organelles. Unlike animals, only scant information is available regarding nitric oxide (NO)-induced autophagy in plants. Such lack of information prompted us to study the roles of the NO donors' nitrate, nitrite, and sodium nitroprusside in this catabolic process in wheat roots. Furthermore, spermine, a polyamine that is found in all eukaryotic cells, was also tested as a physiological NO donor. Here, we show that in wheat roots, NO donors and spermine can trigger autophagy, with NO and reactive oxygen species (ROS) playing signaling roles based on the visualization of autophagosomes, analyses of the levels of NO, ROS, mitochondrial activity, and the expression of autophagic (ATG) genes. Treatment with nitrite and nitroprusside causes an energy deficit, a typical prerequisite of autophagy, which is indicated by a fall in mitochondrial potential, and the activity of mitochondrial complexes. On the contrary, spermine sustains energy metabolism by upregulating the activity of appropriate genes, including those that encode glyceraldehyde 3-phosphate dehydrogenase GAPDH and SNF1-related protein kinase 1 SnRK1. Taken together, our data suggest that one of the key roles for NO in plants may be to trigger autophagy via diverse mechanisms, thus facilitating the removal of oxidized and damaged cellular constituencies.

Keywords: autophagy; energy metabolism; nitric oxide; plant; spermine.


Conflict of interest statement

The authors declare no conflict of interest. The funders had no role in the design of the study; in the collection, analyses, or interpretation of data; in the writing of the manuscript; or in the decision to publish the results.

Figures

Figure 1
Figure 1
Formation of autophagosomes and the expression of autophagic proteins in the wheat roots treated with NO donors and spermine: (a) representative confocal microscopy images of autophagosomes obtained using the fluorescent probe LysoTracker Red (λab 577 nm/λem 590 nm, bar = 50 μm). The arrows indicate autophagosomes, the circles indicate LysoTracker Red-positive conglomerates. Digital quantification of the relative LysoTracker Red fluorescence is presented in Figure S3. (b) mRFP-TaATG8c-dependent fluorescence corresponding to the presence of autophagosomes in Nicotiana benthamiana leaves after exposure to 10 μM of spermine; bar = 20 μm. (c) representative western blots of the TaATG4B and TaATG8 proteins from wheat roots after 3 h of treatment with NO donors and spermine. α-Tubulin was used as a loading control. Digital quantification of the western blot changes is presented in Figure S4. Data represent typical images of at least three replicates.
Figure 2
Figure 2
qPCR analysis of the time-course of ATG gene expression in wheat roots treated with (a) NO donors; (b) spermine. Downregulated gene expression is indicated by green, while upregulated gene expression is indicated by red. An asterisk (*) denotes a significant difference between the control and treatments according to ANOVA (p < 0.05, n = 6). For (b) statistically significant differences in the effects on gene expression, the the time of exposure and the concentrations of spermine were derived from a two-way ANOVA (Table S2). Differences were significant at (*) p ≤ 0.05, (**) p ≤ 0.01.
Figure 3
Figure 3
NO production in wheat roots treated with NO donors and spermine: (a) representative confocal microscopy images of NO-dependent fluorescence obtained using the fluorescent probe DAF-FM (λab 495 nm/λem 515 nm, bar = 50 μm); (b) EPR spectra of (DETC)2-Fe2+-NO signal (dotted line). Data represent typical images of at least three replicates.
Figure 4
Figure 4
Mitochondrial membrane potential and in-gel activity of mitochondrial OXPHOS complexes and supercomplexes in NO donors and spermine-treated wheat roots: (a) representative confocal microscopy images of mitochondrial membrane potential-dependent fluorescence obtained using the fluorescent probe TMRM (λab 543 nm/λem 573 nm, bar = 50 μm). Digital quantification of the relative TMRM fluorescence is presented in Figure S5. (b) Representative BN-PAGE images of mitochondrial OXPHOS complexes and supercomplexes. Lane A—native protein markers, Coomassie staining. Lane B—OXPHOS complexes and supercomplexes: I—complex I; III2—dimer of complex III; S—supercomplexes I + III2 + IV; III2 + IV, Coomassie staining. Lane C—in-gel activity of complex I, staining by nitro blue tetrazolium (NBT). Lane D—in-gel activity of complex IV, complex III2, and supercomplex III2 + IV; staining by diaminobenzidine (DAB). C—control, SNP—sodium nitroprusside. Digital quantifications of the relative activity of complexes IV and III2 and supercomplex III2 + IV are presented in Figure S6. Data represent typical images of at least three replicates.
Figure 5
Figure 5
qPCR analysis of the time-course of energy-related gene expression in wheat roots treated with (a) NO donors; (b) spermine. Downregulated gene expression is indicated by green, while upregulated gene expression is indicated by red. An asterisk (*) denotes a significant difference between the control and treatments according to ANOVA (p < 0.05, n = 6). For (b) statistically significant differences in the effects on gene expression, the time of exposure and the concentrations of spermine were derived from a two-way ANOVA (Table S2). Differences were significant at (*) p ≤ 0.05, (**) p ≤ 0.01.

References

    1. Kroemer G., Mariño G., Levine B. Autophagy and the integrated stress response. Mol. Cell. 2010;40:280–293. doi: 10.1016/j.molcel.2010.09.023. - DOI - PMC - PubMed
    1. He C. Mechanisms of autophagy: The machinery of macroautophagy and points of control. In: Rothermel B.A., Diwan A., editors. Autophagy in Health and Disease. 2nd ed. Elsevier; Philadelphia, PA, USA: Academic Press; Cambridge, MA, USA: 2022. pp. 9–19. - DOI
    1. Corpas F.J., Barroso J.B., Carreras A., Valderrama R., Palma J.M., León A.M., Sandalio L.M., del Río L.A. Constitutive arginine-dependent nitric oxide synthase activity in different organs of pea seedlings during plant development. Planta. 2006;224:246–254. doi: 10.1007/s00425-005-0205-9. - DOI - PubMed
    1. Campbell W.H. Nitrate reductase and its role in nitrate assimilation in plants. Physiol. Plant. 1988;74:214–219. doi: 10.1111/j.1399-3054.1988.tb04965.x. - DOI
    1. Bright J., Desikan R., Hancock J.T., Weir I.S., Neill S.J. ABA-induced NO generation and stomatal closure in Arabidopsis are dependent on H2O2 synthesis. Plant J. 2006;45:113–122. doi: 10.1111/j.1365-313X.2005.02615.x. - DOI - PubMed