

Berry Extracts and Their Bioactive Compounds Mitigate LPS and DNFB-Mediated Dendritic Cell Activation and Induction of Antigen Specific T-Cell Effector Responses
- PMID: 37759970
- PMCID: PMC10525528
- DOI: 10.3390/antiox12091667
Berry Extracts and Their Bioactive Compounds Mitigate LPS and DNFB-Mediated Dendritic Cell Activation and Induction of Antigen Specific T-Cell Effector Responses
Abstract
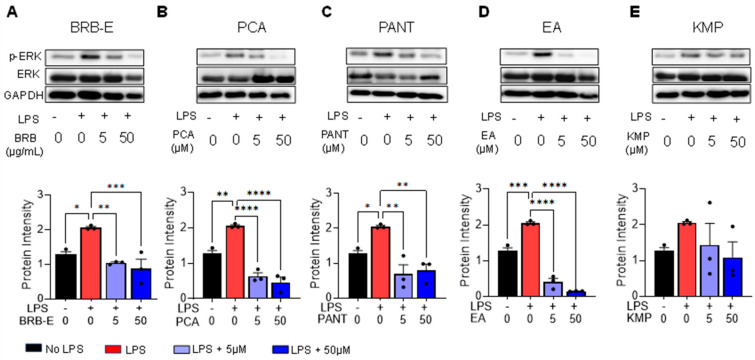
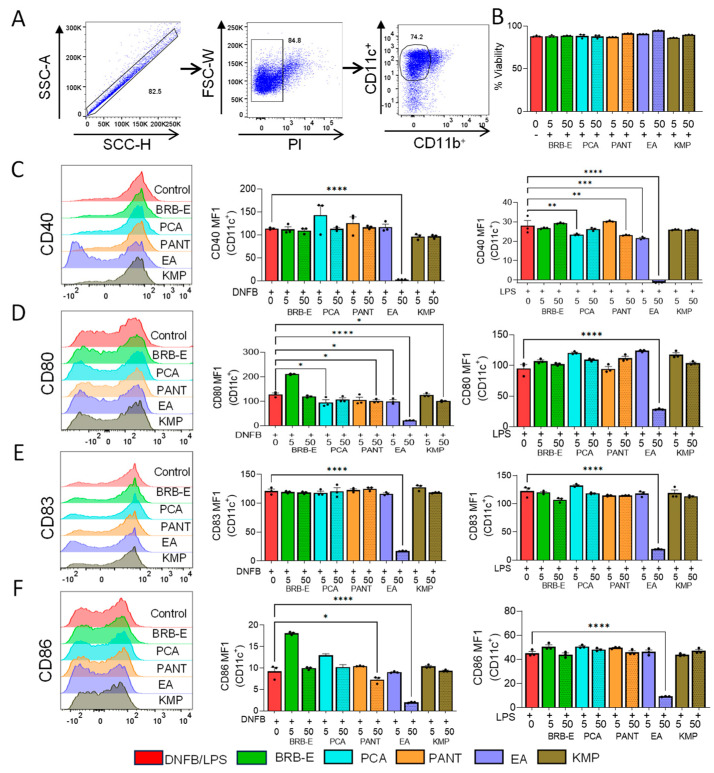
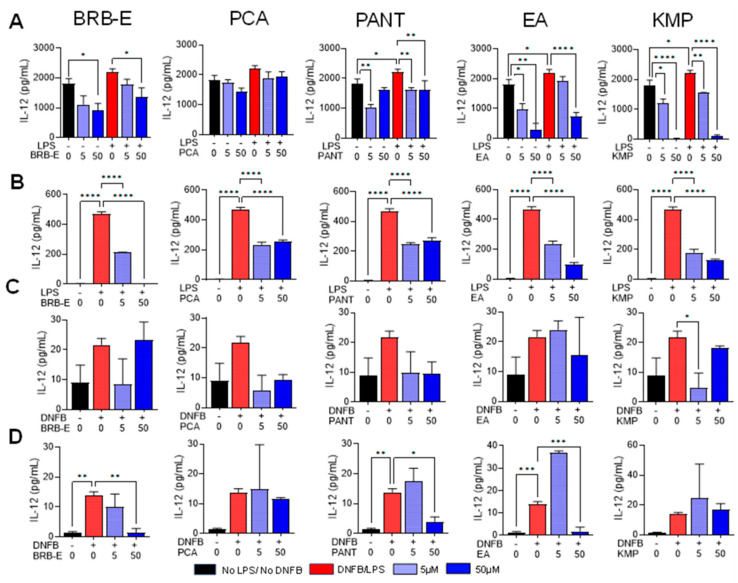
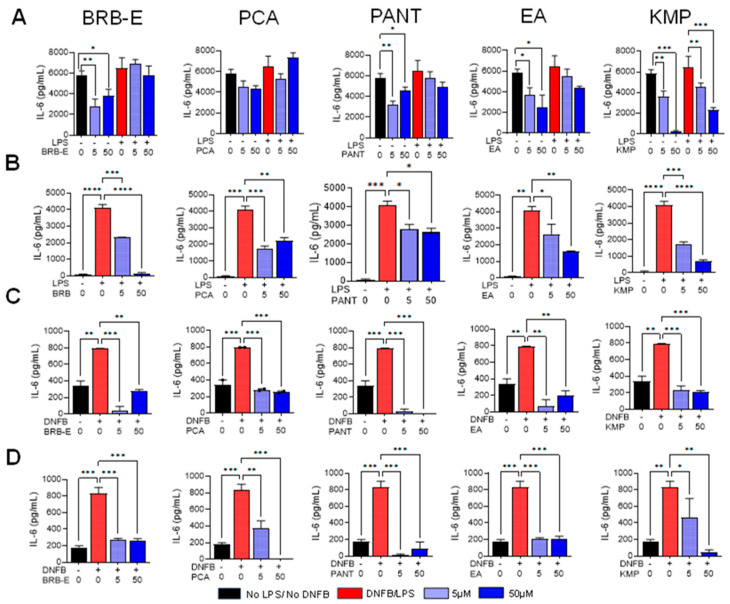
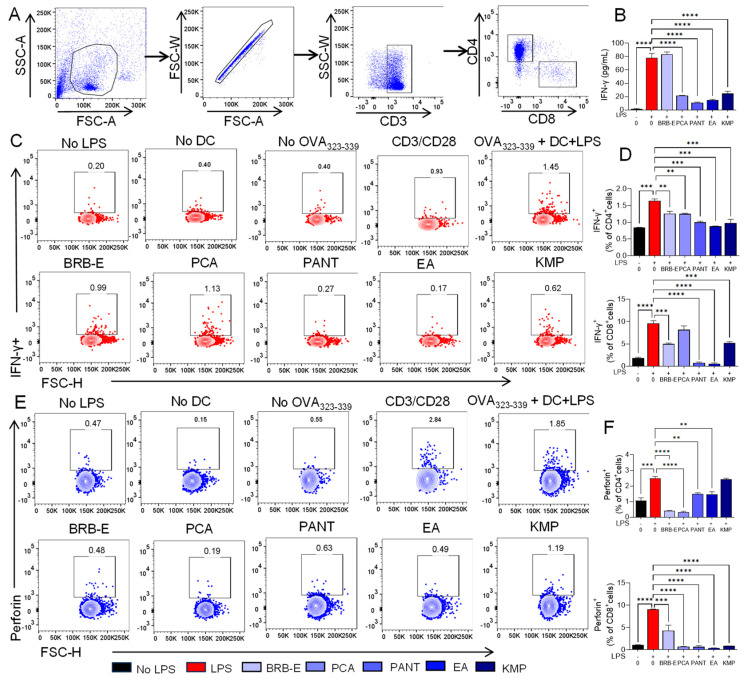
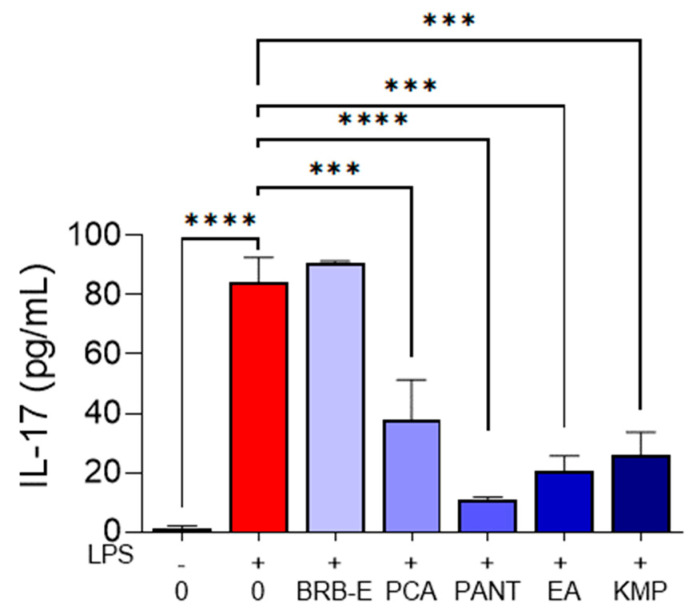
Berries have gained widespread recognition for their abundant natural antioxidant, anti-inflammatory, and immunomodulatory properties. However, there has been limited research conducted thus far to investigate the role of the active constituents of berries in alleviating contact hypersensitivity (CHS), the most prevalent occupational dermatological disease. Our study involved an ex vivo investigation aimed at evaluating the impact of black raspberry extract (BRB-E) and various natural compounds found in berries, such as protocatechuic acid (PCA), proanthocyanidins (PANT), ellagic acid (EA), and kaempferol (KMP), on mitigating the pathogenicity of CHS. We examined the efficacy of these natural compounds on the activation of dendritic cells (DCs) triggered by 2,4-dinitrofluorobenzene (DNFB) and lipopolysaccharide (LPS). Specifically, we measured the expression of activation markers CD40, CD80, CD83, and CD86 and the production of proinflammatory cytokines, including Interleukin (IL)-12, IL-6, TNF-α, and IL-10, to gain further insights. Potential mechanisms through which these phytochemicals could alleviate CHS were also investigated by investigating the role of phospho-ERK. Subsequently, DCs were co-cultured with T-cells specific to the OVA323-339 peptide to examine the specific T-cell effector responses resulting from these interactions. Our findings demonstrated that BRB-E, PCA, PANT, and EA, but not KMP, inhibited phosphorylation of ERK in LPS-activated DCs. At higher doses, EA significantly reduced expression of all the activation markers studied in DNFB- and LPS-stimulated DCs. All compounds tested reduced the level of IL-6 in DNFB-stimulated DCs in Flt3L as well as in GM-CSF-derived DCs. However, levels of IL-12 were reduced by all the tested compounds in LPS-stimulated Flt3L-derived BMDCs. PCA, PANT, EA, and KMP inhibited the activated DC-mediated Interferon (IFN)-γ and IL-17 production by T-cells. Interestingly, PANT, EA, and KMP significantly reduced T-cell proliferation and the associated IL-2 production. Our study provides evidence for differential effects of berry extracts and natural compounds on DNFB and LPS-activated DCs revealing potential novel approaches for mitigating CHS.
Keywords: antioxidants; berries; contact hypersensitivity; immune response.
Conflict of interest statement
The authors declare no conflict of interest.
Figures

Similar articles
-
Black Raspberries and Protocatechuic Acid Mitigate DNFB-Induced Contact Hypersensitivity by Down-Regulating Dendritic Cell Activation and Inhibiting Mediators of Effector Responses.Nutrients. 2020 Jun 6;12(6):1701. doi: 10.3390/nu12061701. Nutrients. 2020. PMID: 32517233 Free PMC article.
-
Effects of histamine and its antagonists on murine T-cells and bone marrow-derived dendritic cells.Drug Des Devel Ther. 2015 Aug 21;9:4847-60. doi: 10.2147/DDDT.S89792. eCollection 2015. Drug Des Devel Ther. 2015. PMID: 26346531 Free PMC article.
-
Comparative analysis of murine marrow-derived dendritic cells generated by Flt3L or GM-CSF/IL-4 and matured with immune stimulatory agents on the in vivo induction of antileukemia responses.Blood. 2002 Dec 1;100(12):4169-76. doi: 10.1182/blood-2002-04-1063. Epub 2002 Aug 8. Blood. 2002. PMID: 12393694
-
IL-21 enhances SOCS gene expression and inhibits LPS-induced cytokine production in human monocyte-derived dendritic cells.J Leukoc Biol. 2006 Jun;79(6):1279-85. doi: 10.1189/jlb.0905503. Epub 2006 Mar 21. J Leukoc Biol. 2006. PMID: 16551679
-
Induction of Interleukin-10 Producing Dendritic Cells As a Tool to Suppress Allergen-Specific T Helper 2 Responses.Front Immunol. 2018 Mar 19;9:455. doi: 10.3389/fimmu.2018.00455. eCollection 2018. Front Immunol. 2018. PMID: 29616018 Free PMC article. Review.
Cited by
-
Targeting Cytokine Dysregulation in Psoriasis: The Role of Dietary Interventions in Modulating the Immune Response.Int J Mol Sci. 2025 Mar 22;26(7):2895. doi: 10.3390/ijms26072895. Int J Mol Sci. 2025. PMID: 40243475 Free PMC article. Review.
-
Berries vs. Disease: Revenge of the Phytochemicals.Pharmaceuticals (Basel). 2024 Jan 9;17(1):84. doi: 10.3390/ph17010084. Pharmaceuticals (Basel). 2024. PMID: 38256917 Free PMC article. Review.
-
The DC-T cell axis is an effective target for the treatment of non-small cell lung cancer.Immun Inflamm Dis. 2023 Nov;11(11):e1099. doi: 10.1002/iid3.1099. Immun Inflamm Dis. 2023. PMID: 38018578 Free PMC article. Review.
-
Prunin: An Emerging Anticancer Flavonoid.Int J Mol Sci. 2025 Mar 16;26(6):2678. doi: 10.3390/ijms26062678. Int J Mol Sci. 2025. PMID: 40141319 Free PMC article. Review.
References
-
- Murphy P.B., Atwater A.R., Mueller M., Collins J. StatPearls©. StatPearls Publishing LLC.; Treasure Island, FL, USA: 2023. Allergic Contact Dermatitis (Nursing) - PubMed
-
- Hamilton T., de Gannes G.C. Allergic contact dermatitis to preservatives and fragrances in cosmetics. Ski. Ther. Lett. 2011;16:1–4. - PubMed
Grants and funding
LinkOut - more resources
Full Text Sources
Research Materials
Miscellaneous
