

Glutathione Transferases Are Involved in the Genotype-Specific Salt-Stress Response of Tomato Plants
- PMID: 37759985
- PMCID: PMC10525892
- DOI: 10.3390/antiox12091682
Glutathione Transferases Are Involved in the Genotype-Specific Salt-Stress Response of Tomato Plants
Abstract
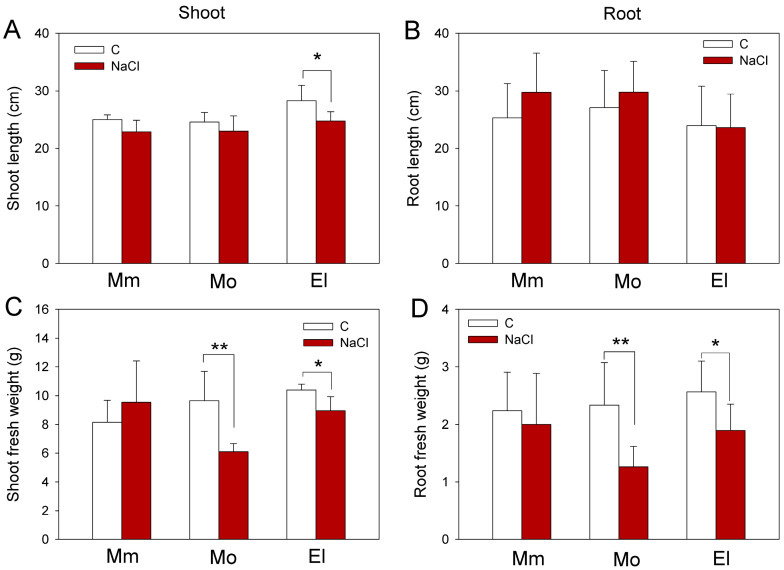
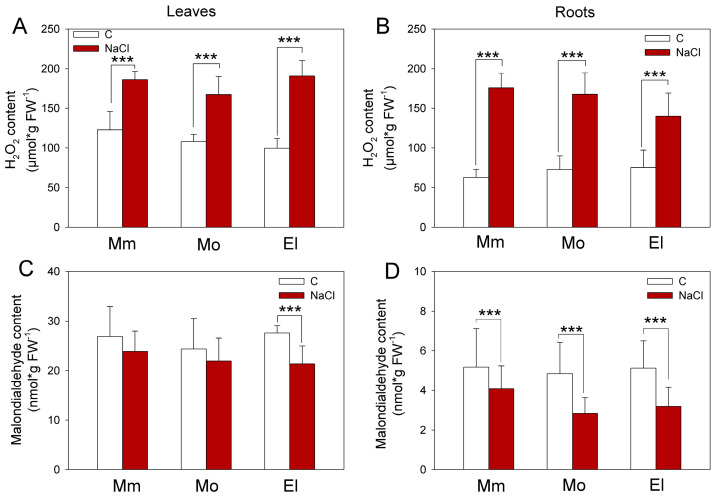
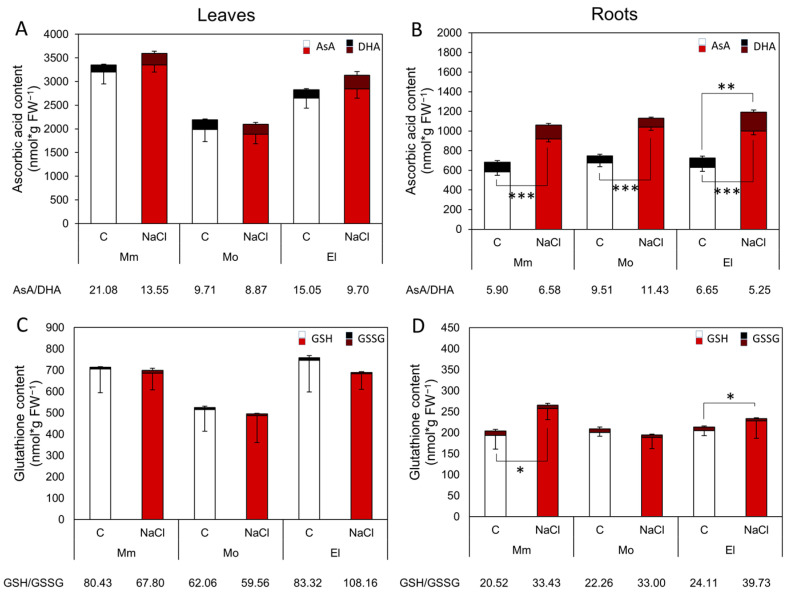
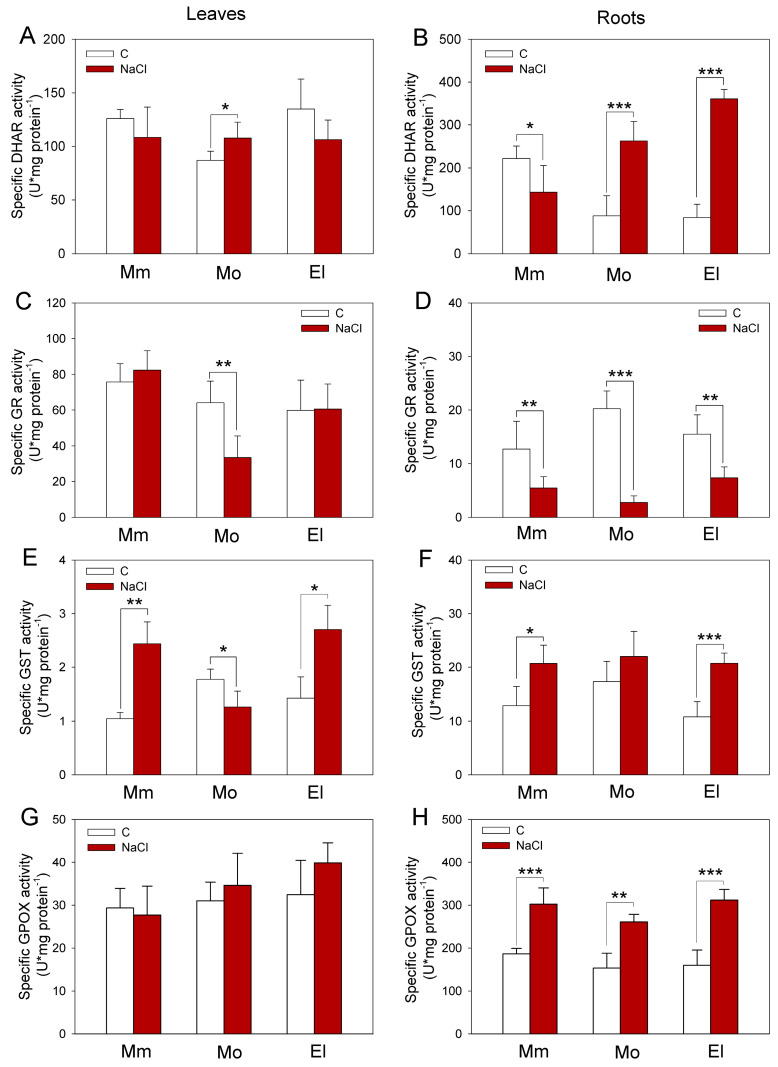
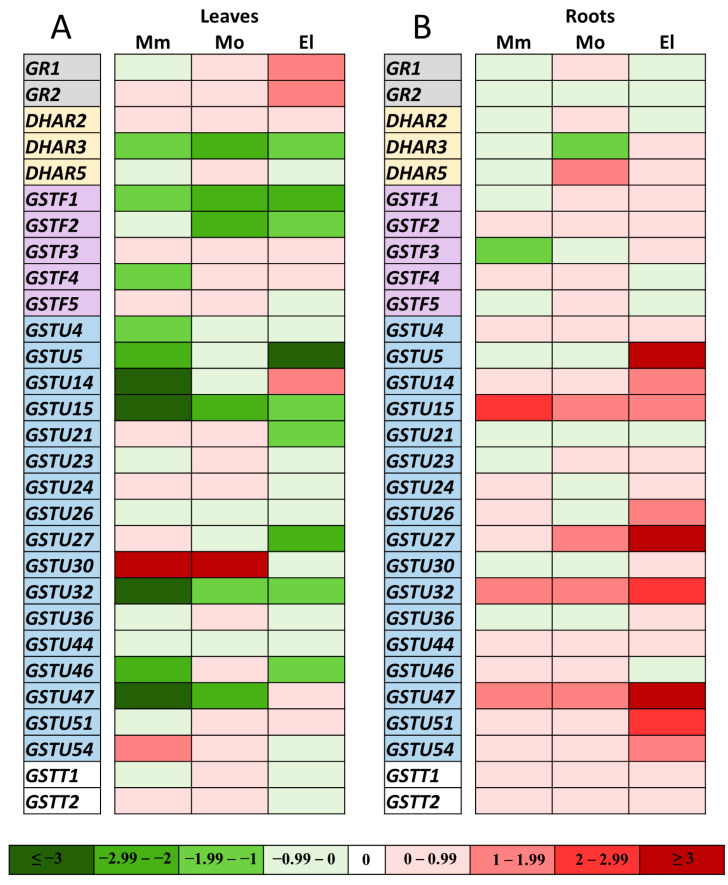
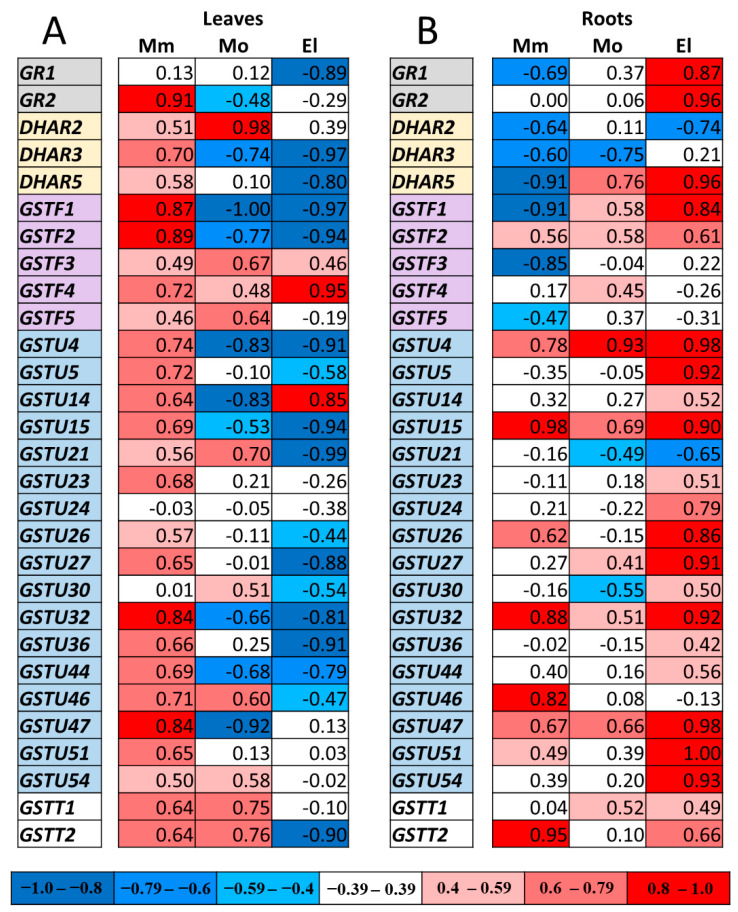
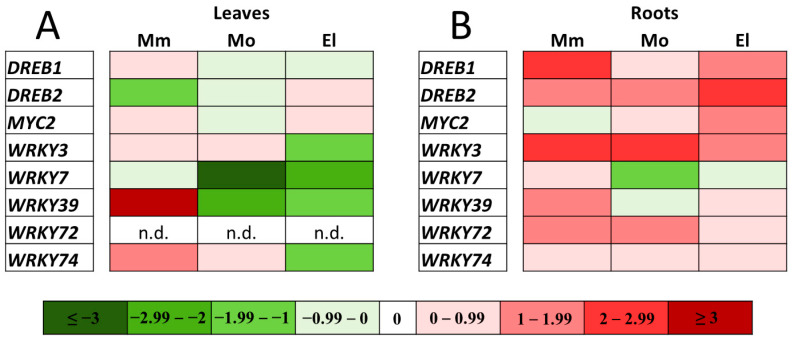
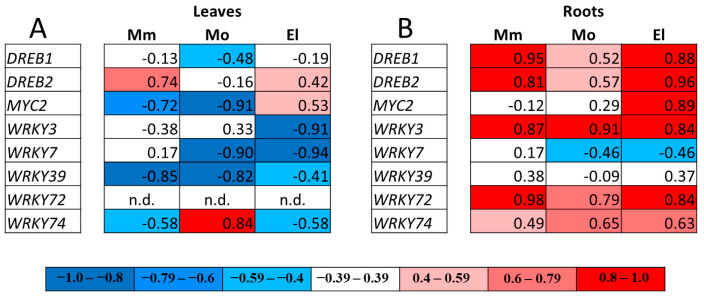
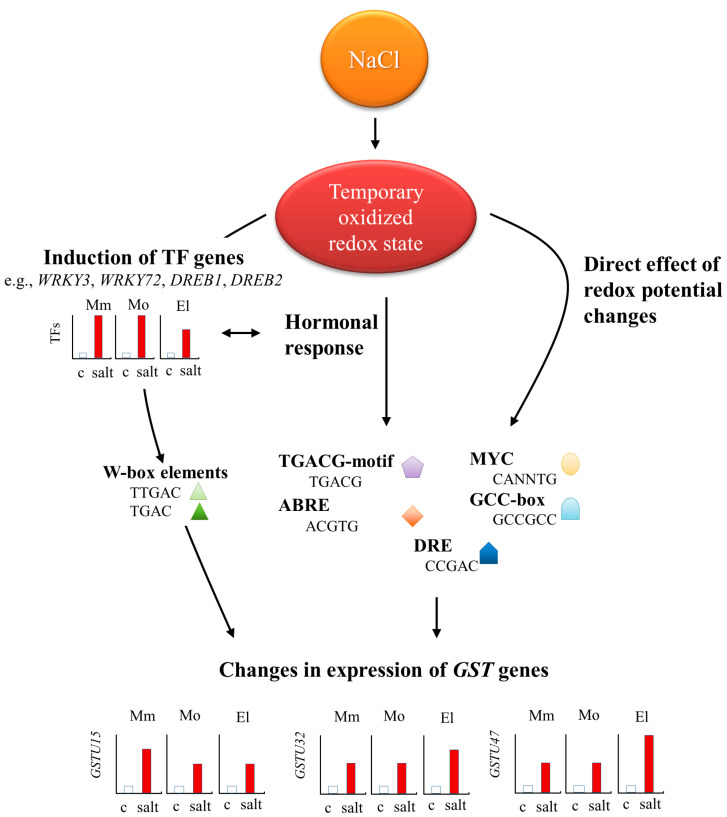
Glutathione transferases (GSTs) are one of the most versatile multigenic enzyme superfamilies. In our experiments, the involvement of the genotype-specific induction of GST genes and glutathione- or redox-related genes in pathways regulating salt-stress tolerance was examined in tomato cultivars (Solanum lycopersicum Moneymaker, Mobil, and Elán F1). The growth of the Mobil plants was adversely affected during salt stress (100 mM of NaCl), which might be the result of lowered glutathione and ascorbate levels, a more positive glutathione redox potential (EGSH), and reduced glutathione reductase (GR) and GST activities. In contrast, the Moneymaker and Elán F1 cultivars were able to restore their growth and exhibited higher GR and inducible GST activities, as well as elevated, non-enzymatic antioxidant levels, indicating their enhanced salt tolerance. Furthermore, the expression patterns of GR, selected GST, and transcription factor genes differed significantly among the three cultivars, highlighting the distinct regulatory mechanisms of the tomato genotypes during salt stress. The correlations between EGSH and gene expression data revealed several robust, cultivar-specific associations, underscoring the complexity of the stress response mechanism in tomatoes. Our results support the cultivar-specific roles of distinct GST genes during the salt-stress response, which, along with WRKY3, WRKY72, DREB1, and DREB2, are important players in shaping the redox status and the development of a more efficient stress tolerance in tomatoes.
Keywords: Solanum lycopersicum L.; glutathione transferases; redox homeostasis; salt stress; transcription regulation.
Conflict of interest statement
The authors declare no conflict of interest.
Figures
Similar articles
-
Glutathione transferase supergene family in tomato: Salt stress-regulated expression of representative genes from distinct GST classes in plants primed with salicylic acid.Plant Physiol Biochem. 2014 May;78:15-26. doi: 10.1016/j.plaphy.2014.02.010. Epub 2014 Feb 19. Plant Physiol Biochem. 2014. PMID: 24607575
-
Crosstalk between the redox signalling and the detoxification: GSTs under redox control?Plant Physiol Biochem. 2021 Dec;169:149-159. doi: 10.1016/j.plaphy.2021.11.009. Epub 2021 Nov 10. Plant Physiol Biochem. 2021. PMID: 34798389
-
Exogenous silicon alters ascorbate-glutathione cycle in two salt-stressed indica rice cultivars (MTU 1010 and Nonabokra).Environ Sci Pollut Res Int. 2018 Sep;25(26):26625-26642. doi: 10.1007/s11356-018-2659-x. Epub 2018 Jul 12. Environ Sci Pollut Res Int. 2018. PMID: 30003482
-
Comparative transcriptomic profiling of a salt-tolerant wild tomato species and a salt-sensitive tomato cultivar.Plant Cell Physiol. 2010 Jun;51(6):997-1006. doi: 10.1093/pcp/pcq056. Epub 2010 Apr 21. Plant Cell Physiol. 2010. PMID: 20410049
-
Overexpression of tomato glutathione reductase (SlGR) in transgenic tobacco enhances salt tolerance involving the S-nitrosylation of GR.Plant Physiol Biochem. 2023 Mar;196:497-506. doi: 10.1016/j.plaphy.2023.02.010. Epub 2023 Feb 6. Plant Physiol Biochem. 2023. PMID: 36764265
Cited by
-
Integrative transcriptome and metabolome analysis reveals the mechanism of fulvic acid alleviating drought stress in oat.Front Plant Sci. 2024 Sep 19;15:1439747. doi: 10.3389/fpls.2024.1439747. eCollection 2024. Front Plant Sci. 2024. PMID: 39363917 Free PMC article.
-
Contrasting roles of reactive oxygen species in pyrophosphate-induced growth inhibition under normal and salt stress conditions.Plant Mol Biol. 2025 Jul 1;115(4):80. doi: 10.1007/s11103-025-01607-4. Plant Mol Biol. 2025. PMID: 40591020
References
-
- Dixon D.P., Davis B.G., Edwards R. Functional divergence in the glutathione transferase superfamily in plants. J. Biol. Chem. 2002;277:30859–30869. - PubMed
-
- Labrou N.E., Papageorgiou A.C., Pavli O., Flemetakis E. Plant GSTome: Structure and functional role in xenome network and plant stress response. Curr. Opin. Biotechnol. 2015;32:186–194. - PubMed
-
- Hernández Estévez I., Rodríguez Hernández M. Plant glutathione S-transferases: An overview. Plant Gene. 2020;23:100233.
-
- Frear D.S., Swanson H.R. Biosynthesis of S-(4-ethylamino-6-isopropylamino- 2-S-triazino) glutathione: Partial purification and properties of a glutathione S-transferase from corn. Phytochemistry. 1970;9:2123–2132.
-
- Edwards R., Dixon D.P. Plant glutathione transferases. Methods Enzymol. 2005;401:169–186. - PubMed
Grants and funding
LinkOut - more resources
Full Text Sources
Research Materials
