. 2023 Sep 11;10(9):1073.
doi: 10.3390/bioengineering10091073.

Production of Astaxanthin by Animal Cells via Introduction of an Entire Astaxanthin Biosynthetic Pathway

Affiliations

Production of Astaxanthin by Animal Cells via Introduction of an Entire Astaxanthin Biosynthetic Pathway

Yousef Mohammed et al. Bioengineering (Basel). .

Abstract

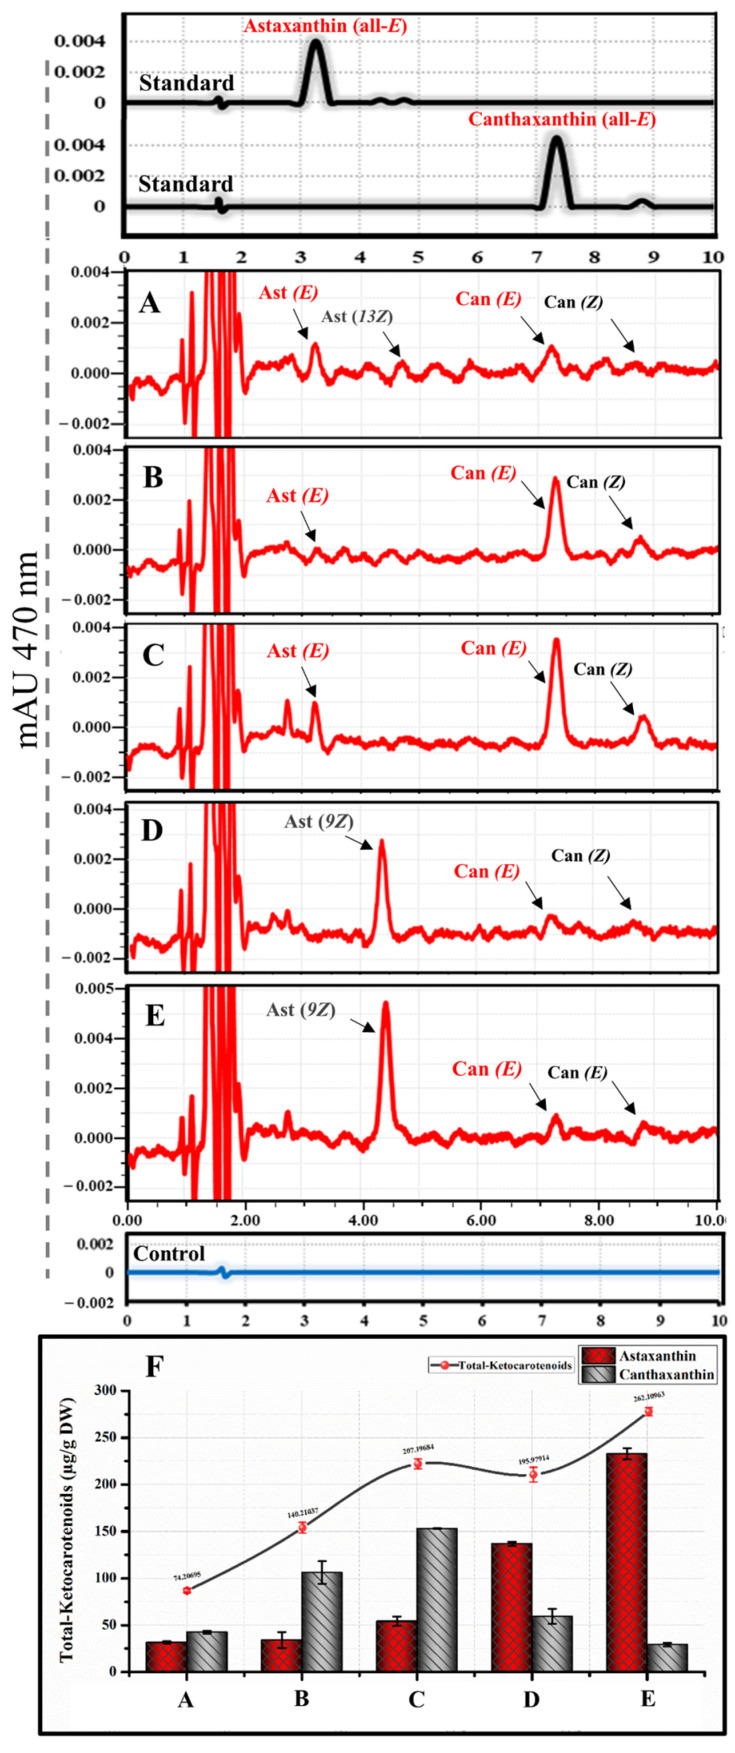
Astaxanthin is a fascinating molecule with powerful antioxidant activity, synthesized exclusively by specific microorganisms and higher plants. To expand astaxanthin production, numerous studies have employed metabolic engineering to introduce and optimize astaxanthin biosynthetic pathways in microorganisms and plant hosts. Here, we report the metabolic engineering of animal cells in vitro to biosynthesize astaxanthin. This was accomplished through a two-step study to introduce the entire astaxanthin pathway into human embryonic kidney cells (HEK293T). First, we introduced the astaxanthin biosynthesis sub-pathway (Ast subp) using several genes encoding β-carotene ketolase and β-carotene hydroxylase enzymes to synthesize astaxanthin directly from β-carotene. Next, we introduced a β-carotene biosynthesis sub-pathway (β-Car subp) with selected genes involved in Ast subp to synthesize astaxanthin from geranylgeranyl diphosphate (GGPP). As a result, we unprecedentedly enabled HEK293T cells to biosynthesize free astaxanthin from GGPP with a concentration of 41.86 µg/g dry weight (DW), which represented 66.19% of the total ketocarotenoids (63.24 µg/g DW). Through optimization steps using critical factors in the astaxanthin biosynthetic process, a remarkable 4.14-fold increase in total ketocarotenoids (262.10 µg/g DW) was achieved, with astaxanthin constituting over 88.82%. This pioneering study holds significant implications for transgenic animals, potentially revolutionizing the global demand for astaxanthin, particularly within the aquaculture sector.

Keywords: animal cells in vitro; astaxanthin; biosynthesis; enzymatic reactions; ketocarotenoids; metabolic engineering; multicistronic vectors; pathway.


Conflict of interest statement

The authors declare no conflict of interest.

Figures

Figure 1
Figure 1
Astaxanthin biosynthesis pathway and constructed plasmids. (A) Simplification of the astaxanthin biosynthetic pathway reconstructed in HEK293T cells. Genes involved in this pathway are as follows: psy1 gene, phytoene synthase; crtI and crtYB genes, phytoene desaturase; lcyb gene, lycopene β-cyclase; crtZ and H.crtZ genes, β-carotene hydroxylase; crtW, bkt3, and cbkI genes, β-carotene ketolase; and DGTT1 and DGTT2 genes, diacylglycerol acyltransferases. The yellow and red background colours indicate the sub-pathways of β-carotene and astaxanthin, respectively. Dashed arrows indicate that reaction was not successfully completed. The heterologous (exogenous) genes and molecules are shown in red. (BI) illustrate the constructed plasmids utilized in this study.
Figure 2
Figure 2
Assessment of the ability of animal cells (HEK293T cells) to synthesize astaxanthin in vitro from β-carotene. (A) Expression of EGFP and HPLC analysis of cells transfected with pWZG-A2 + β-carotene. (B) Expression of EGFP and HPLC analysis of cells transfected with pbk3HZG-A2 + β-carotene. (C) Expression of EGFP and HPLC analysis of cells transfected with pCIKHZG-A2 + β-carotene. (D) Expression of mCherry and HPLC analysis of cells transfected with pWZg2R-A2 + β-carotene. (E) Expression of mCherry and HPLC analysis of cells transfected with pWZg1R-A2 + β-carotene. Can, canthaxanthin; Ast, astaxanthin; E, trans geometric isomer; and Z, cis geometric isomer. (F) Ketocarotenoid concentration graph for HEK293T cell extracts transfected with the above-mentioned plasmids. DW, dry weight. Results were presented as means ± SD of three biological replicates.
Figure 3
Figure 3
Construction of the astaxanthin biosynthetic pathway in HEK293T cells. (A) Expression of EGFP and mCherry in HEK293T cells transfected with pPYLG + pWZG-P2A plasmids. (B) HPLC analysis of cells transfected with above-mentioned plasmids. Can, canthaxanthin; Ast, astaxanthin; E, trans geometric isomer; and Z, cis geometric isomer. (C) Total ketocarotenoid concentration graph compared with the ratio of astaxanthin and canthaxanthin content. DW, dry weight. (D) Astaxanthin and canthaxanthin concentration graphs from cell extracts transfected with pPYLG + pWZG-P2A plasmids. (E) Pie charts show total ketocarotenoids with different percentages of astaxanthin and canthaxanthin content.
Figure 4
Figure 4
Evaluation of exogenous GGPP addition for total ketocarotenoid optimization in transfected HEK293T cells with β-carotene and astaxanthin biosynthetic genes. (A) Expression of EGFP and mCherry in HEK293T cells transfected with pPYLG + pWZG-P2A constructs and supplied with GGPP. (B) HPLC analysis of cells transfected with above-mentioned plasmids and supplied with GGPP. Can, canthaxanthin; Ast, astaxanthin; E, trans geometric isomer; and Z, cis geometric isomer. (C) Total ketocarotenoid concentration graph compared with the ratio of astaxanthin and canthaxanthin content. DW, dry weight. (D) Astaxanthin and canthaxanthin concentration graphs from cell extracts transfected with pPYLG + pWZG-P2A and supplied with exogenous GGPP. (E) The HEK293T cell pellets with a red hue reflect ketocarotenoid accumulation. (F) Pie charts outline total ketocarotenoids with different percentages of astaxanthin and canthaxanthin content.
Figure 5
Figure 5
Comparative synthesis of ketocarotenoids in HEK293T cells transfected with different multiple expression plasmids. (AE) are RP-HPLC chromatograms of ketocarotenoids for HEK293T cell extracts transfected with pWZG-A2 + β-carotene, pWZg1R-A2 + β-carotene, pPYLG + pWZG-P2A + GGPP, pAPLG + pWZG-P2A + pcrtZ-R + GGPP, and pPYLG + pWZG-P2A + pcrtZ-R + GGPP, respectively. Can, Canthaxanthin; Ast, astaxanthin; E, trans geometric isomer; and Z, cis geometric isomer. (F) Quantitative analysis of total ketocarotenoids (including canthaxanthin or astaxanthin). DW, dry weight. Data were presented as means ± SD (three biological replicates).
Figure 6
Figure 6
Estimate of the individual expression of crtZ gene for astaxanthin content enhancement in transfected HEK293T cells with β-carotene and astaxanthin biosynthetic genes. (A) Expression of EGFP and mCherry in HEK293T cells transfected with pPYLG + pWZG-P2A + pcrtZ-R constructs supplied with GGPP. (B) HPLC analysis of cells transfected with above-mentioned plasmids and supplied with GGPP. Can, canthaxanthin; Ast, astaxanthin; E, trans geometric isomer; and Z, cis geometric isomer. (C) Total ketocarotenoid concentration compared with the ratio of astaxanthin content. DW, dry weight. (D) Astaxanthin and canthaxanthin concentration graphs from cell extracts transfected with pPYLG + pWZG-P2A + pcrtZ-R plasmids and supplied with GGPP. (E) HEK293T cell pellets with a red color indicate the accumulation of astaxanthin. (F) Pie charts show total ketocarotenoids with different percentages of astaxanthin and canthaxanthin content.
Figure 7
Figure 7
Quantitative and qualitative analytical Charts for metabolically engineered HEK293T cells using different multiple expression plasmids for astaxanthin biosynthesis. (A) Total ketocarotenoid concentration graph (including canthaxanthin or astaxanthin) from cell extracts transfected with different collections of plasmids. DW, dry weight. (B) Total ketocarotenoid concentration comparison with astaxanthin content and ratio. (C) Total ketocarotenoid concentration comparison with canthaxanthin content and ratio. Data were presented as means ± SD (three biological replicates), and a one-way ANOVA analysis was used to determine the significant differences between different approaches. p-values were calculated and represented as p < 0.05, p < 0.01, and p < 0.001 and indicated by *, **, and ***, respectively. (D) Transfected HEK293T cell pellets with red color indicate the accumulation of ketocarotenoids compared with control samples.

Similar articles

Cited by

References

    1. Davinelli S., Nielsen M.E., Scapagnini G. Astaxanthin in Skin Health, Repair, and Disease: A Comprehensive Review. Nutrients. 2018;10:522. doi: 10.3390/nu10040522. - DOI - PMC - PubMed
    1. Eggersdorfer M., Wyss A. Carotenoids in Human Nutrition and Health. Arch. Biochem. Biophys. 2018;652:18–26. doi: 10.1016/j.abb.2018.06.001. - DOI - PubMed
    1. Moran N.A., Jarvik T. Lateral Transfer of Genes from Fungi Underlies Carotenoid Production in Aphids. Science. 2010;328:624–627. doi: 10.1126/science.1187113. - DOI - PubMed
    1. Pierce E.C., LaFayette P.R., Ortega M.A., Joyce B.L., Kopsell D.A., Parrott W.A. Ketocarotenoid Production in Soybean Seeds through Metabolic Engineering. PLoS ONE. 2015;10:e0138196. doi: 10.1371/journal.pone.0138196. - DOI - PMC - PubMed
    1. Britton G., Liaaen-Jensen S., Pfander H., editors. Carotenoids: Handbook. Springer; Bronx, NY, USA: Birkhäuser; Basel, Switzerland: 2004.