. 2023 Sep 7;13(18):2839.
doi: 10.3390/ani13182839.

Nociception in Chicken Embryos, Part II: Embryonal Development of Electroencephalic Neuronal Activity In Ovo as a Prerequisite for Nociception

Affiliations

Nociception in Chicken Embryos, Part II: Embryonal Development of Electroencephalic Neuronal Activity In Ovo as a Prerequisite for Nociception

Sandra Kollmansperger et al. Animals (Basel). .

Abstract

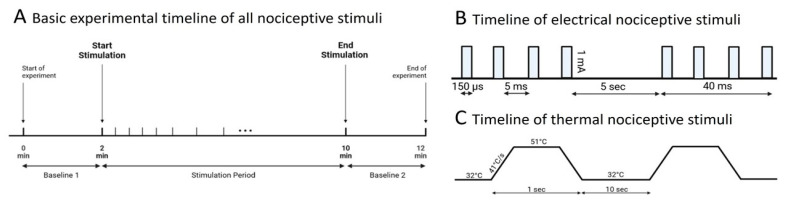
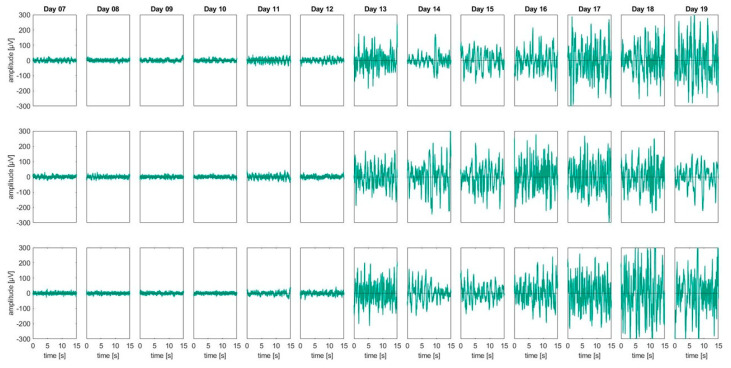
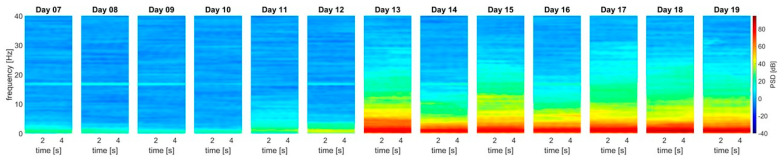
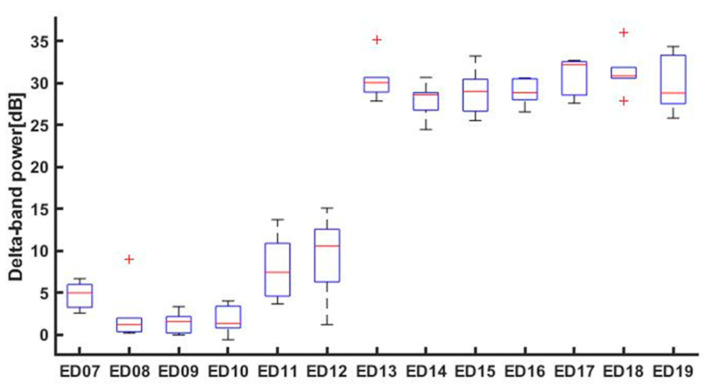
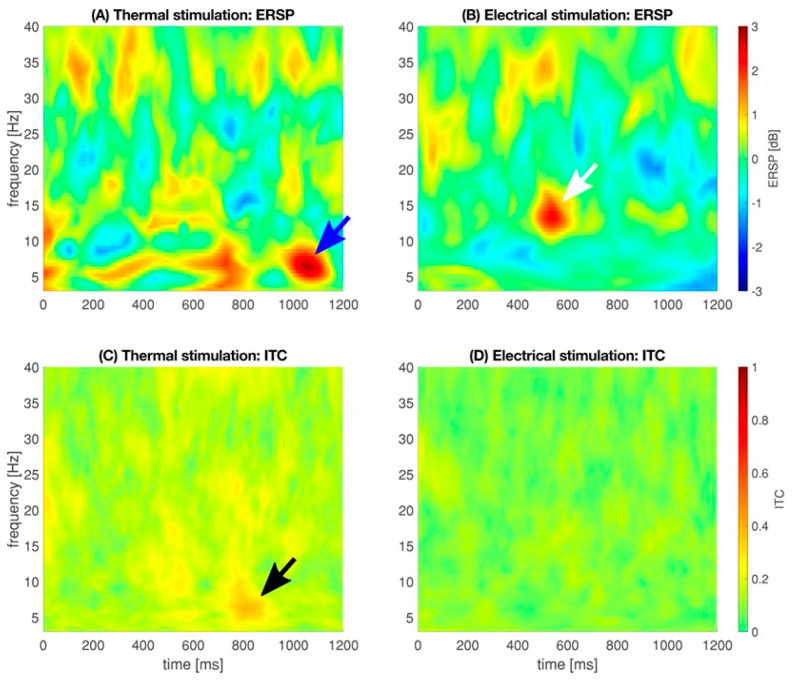
Chicken culling has been forbidden in Germany since 2022; male/female selection and male elimination must be brought to an embryonic status prior to the onset of nociception. The present study evaluated the ontogenetic point at which noxious stimuli could potentially be perceived/processed in the brain in ovo. EEG recordings from randomized hyperpallial brain sites were recorded in ovo and noxious stimuli were applied. Temporal and spectral analyses of the EEG were performed. The onset of physiological neuronal signals could be determined at developmental day 13. ERP/ERSP/ITC analysis did not reveal phase-locked nociceptive responses. Although no central nociceptive responses were documented, adequate EEG responses to noxious stimuli from other brain areas cannot be excluded. The extreme stress impact on the embryo during the recording may overwrite the perception of noniceptive stimuli. The results suggest developmental day 13 as the earliest embryonal stage being able to receive and process nociceptive stimuli.

Keywords: EEG; Gallus gallus domesticus; development; embryo; nociception; pain.


Conflict of interest statement

The authors declare no conflict of interest.

Figures

Figure 1
Figure 1
Experimental timeline for EEG recordings in chicken embryos. (A) The total duration of a single recording was 12 min, starting and ending with 2 min of baseline EEG recordings. The stimulation duration was 8 min. (B) Electrical stimulation was administered at 1 mA, pulse duration: 150 µs, inter-pulse interval: 5 ms, pulse train: 40 ms at 5 s, 90 repetitions/stimulus. (C) Thermal stimuli were given at 51 °C with a heating rate of 41 °C/s for 1 s and repeated every 10 s for 40 times. Basal temperature was kept at 32 °C.
Figure 2
Figure 2
Raw EEG data: An overview of 15 s of raw EEG from three randomly chosen embryo datasets at development stages ED07-ED19. An onset of physiological EEG signatures is prominently visible from ED13 and onwards. The raw EEG amplitudes from ED07 until ED12 partly exceeded ±50 µV, but never exceeded ±100 µV, randomly fluctuating around baseline (0 µV). A strong increase in the EEG signal can be seen from ED13-ED19, with an amplitude regularly exceeding ±200 µV. The plots do not represent longitudinal recordings from ED07-ED19 within one embryo. For each day an individual embryo was recorded and added to a longitudinal graphical presentation representing the global findings.
Figure 3
Figure 3
Top. Spectral power density: ED07-ED12 revealed no prominent power in all relevant frequency bands, apart from some minor but consistent oscillations in the low delta regions around 1–2 Hz and an isolated signal at 16.33 Hz. The onset of slow delta oscillations is visible from ED13 onwards. For each developmental day, data from 6 representative EEGs were processed. Bottom: Boxplots illustrating the median (red line), the 25% and 75% percentiles (lower and upper box end) and the minimum/maximum values (lower and upper whisker) for the delta band power. Red crosses indicate outliers. AUCED10/ED11: 0.97 [0.83, 1], AUCED12/ED13: 1 [1, 1], only significant AUCs reported (refer to Table 2 for other data).
Figure 3
Figure 3
Top. Spectral power density: ED07-ED12 revealed no prominent power in all relevant frequency bands, apart from some minor but consistent oscillations in the low delta regions around 1–2 Hz and an isolated signal at 16.33 Hz. The onset of slow delta oscillations is visible from ED13 onwards. For each developmental day, data from 6 representative EEGs were processed. Bottom: Boxplots illustrating the median (red line), the 25% and 75% percentiles (lower and upper box end) and the minimum/maximum values (lower and upper whisker) for the delta band power. Red crosses indicate outliers. AUCED10/ED11: 0.97 [0.83, 1], AUCED12/ED13: 1 [1, 1], only significant AUCs reported (refer to Table 2 for other data).
Figure 4
Figure 4
Median oscillatory responses as event-related spectral perturbation (ERSP, (A,B)), indicating the phase response, i.e., the oscillatory changes at a given time and frequency as a response to the stimulus. Inter-trial coherence (ITC, (C,D)), indicating the degree of phase-locking, i.e., the phase distribution of the stimulus across all trials. Blue arrow: local spectral maximum of 2.79 dB [−2.15 dB/5.16 dB] at 6.41 Hz and 1052 ms. White arrow: local spectral maximum of 2.23 dB [0.68 dB/2.23 dB] at 13.24 Hz and 543 ms. Black arrow: local ITC maximum of 0.38 [0.27/0.42] occurred at 6.41 Hz and 797 ms.
Figure 5
Figure 5
Anatomical differences of the embryonal brain: The two frontal sections (100 µm) from the central brain area represent the neuronal development of the embryonal brain from ED13 (right) and ED19 (left). Abbreviations: CO: Chiasma opticum, CP: Commissura posterior [caudalis] (Posterior commissure), CT: Commissura tectalis, D: Nucleus of Darkschewitsch; Nucleus paragrisealis centralis mesencephali (ICAAN), IS: Nucleus interstitialis (Cajal), ME: Eminentia mediana (Median eminence), PVO: Organum paraventriculare (Paraventricular organ), SAC: Stratum album centrale, SCE: Stratum cellulare externum, SCO: Organum subcommissurale (Subcommissural organ), SGC: Stratum granimalsiseum centrale, SGFS: Stratum griseum et fibrosum superficiale, SGP: Stratum griseum periventriculare, SO: Stratum opticum, SpL: Nucleus spiriformis lateralis, SpM: Nucleus spiriformis medialis, VT: Ventriculus tecti mesencephalic. The anatomical nomenclature was referred to anatomical atlases [15,46].

Similar articles

Cited by

References

    1. Reithmayer C., Mußhoff O. Consumer preferences for alternatives to chick culling in Germany. Poult. Sci. 2019;98:4539–4548. doi: 10.3382/ps/pez272. - DOI - PubMed
    1. Krautwald-Junghanns M.E., Cramer K., Fischer B., Förster A., Galli R., Kremer F., Mapesa E.U., Meissner S., Preisinger R., Preusse G., et al. Current approaches to avoid the culling of day-old male chicks in the layer industry, with special reference to spectroscopic methods. Poult. Sci. 2017;97:749–757. doi: 10.3382/ps/pex389. - DOI - PubMed
    1. Sandercock D. Putative nociceptor responses to mechanical and chemical stimulation in skeletal muscles of the chicken leg. Brain Res. Rev. 2004;46:155–162. doi: 10.1016/j.brainresrev.2004.07.020. - DOI - PubMed
    1. Gentle M.J., Hunter L.N. Physiological and behavioural responses associated with feather removal in Gallus gallus var domesticus. Res. Vet. Sci. 1990;50:95–101. - PubMed
    1. Woolley S.C., Gentle M.J. Physiological and behavioural responses in the hen (Gallus domesticus) to nociceptive stimulation. Comp. Biochem. Physiol. A Comp. Physiol. 1987;88:27–31. doi: 10.1016/0300-9629(87)90093-4. - DOI - PubMed

LinkOut - more resources