. 2023 Sep 15;13(18):2935.
doi: 10.3390/ani13182935.

PorcineAI-Enhancer: Prediction of Pig Enhancer Sequences Using Convolutional Neural Networks

Affiliations

PorcineAI-Enhancer: Prediction of Pig Enhancer Sequences Using Convolutional Neural Networks

Ji Wang et al. Animals (Basel). .

Abstract

Understanding the mechanisms of gene expression regulation is crucial in animal breeding. Cis-regulatory DNA sequences, such as enhancers, play a key role in regulating gene expression. Identifying enhancers is challenging, despite the use of experimental techniques and computational methods. Enhancer prediction in the pig genome is particularly significant due to the costliness of high-throughput experimental techniques. The study constructed a high-quality database of pig enhancers by integrating information from multiple sources. A deep learning prediction framework called PorcineAI-enhancer was developed for the prediction of pig enhancers. This framework employs convolutional neural networks for feature extraction and classification. PorcineAI-enhancer showed excellent performance in predicting pig enhancers, validated on an independent test dataset. The model demonstrated reliable prediction capability for unknown enhancer sequences and performed remarkably well on tissue-specific enhancer sequences.The study developed a deep learning prediction framework, PorcineAI-enhancer, for predicting pig enhancers. The model demonstrated significant predictive performance and potential for tissue-specific enhancers. This research provides valuable resources for future studies on gene expression regulation in pigs.

Keywords: convolutional neural networks; enhancer; sequence classification.


Conflict of interest statement

The authors declare no conflict of interest.

Figures

Figure 1
Figure 1
Enhancer Source Venn Diagram. Each circle representing a specific source, the overlapping regions indicate the common enhancers shared between the sources, while the non-overlapping regions represent the unique enhancers specific to each source. MacPhillamy et al. [59] and Pan et al. [64].
Figure 2
Figure 2
Training and Validation Process for PorcineAI-Enhancer Model using Stratified Sampling and Ensemble Learning. This figure illustrates the training and validation process for the PorcineAI-Enhancer model. The training set is randomly divided into five folds or partitions using stratified sampling, allowing for a balanced representation of the data in each fold. Each fold is then used as the validation set in turn, while the remaining four folds are used as the training set for training the Convolutional Neural Network (CNN) model. The five trained CNN models are combined to form an ensemble model, which is used to test the samples in an independent test set. This entire process, including data partitioning, model training, and model testing, is repeated five times to observe the variation in model performance across the five experiments. The use of stratified sampling and ensemble learning helps to improve the accuracy and robustness of the PorcineAI-Enhancer model.
Figure 3
Figure 3
Differences in Information Entropy of Enhancer and Non-Enhancer Sequences Revealed by SeqLogo Analysis. In this figure, we show the results of SeqLogo analysis, which is a graphical representation of the conservation and variation of nucleotide or amino acid sequences. The vertical axis of the SeqLogo plot can be scaled using frequency or bits. Our analysis reveals that enhancer sequences and non-enhancer sequences exhibit significant differences in their information entropy when bits are used as the vertical axis. This indicates that enhancer sequences and non-enhancer sequences possess distinct characteristics in terms of sequence conservation and variation, which may be associated with their different roles in gene expression regulation. These findings provide further insights into the functional differences between enhancer and non-enhancer sequences and may have implications for understanding the mechanisms of gene expression regulation.
Figure 4
Figure 4
PorcineAI-enhancer model training loss curves. The horizontal axis represents the number of training epochs, and the vertical axis represents the model’s loss value. The loss value is a metric that measures the difference between the model’s predictions and the actual labels. Our goal is to minimize the loss value through training. We observe two different loss curves. One is the loss curve on the training set, which indicates the model’s fit to the training data. The other curve is the loss curve on the validation set, which represents the model’s performance on unseen data. We use the validation set to evaluate the model’s generalization ability in real-world scenarios. Typically, we select the epoch corresponding to the minimum validation set loss as the optimal model’s parameters.
Figure 5
Figure 5
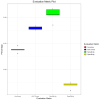
Robust Performance of Deep Learning Models in Predicting Enhancer Sequences. We present the evaluation metrics of five deep learning models in predicting enhancer sequences. The models demonstrate high accuracy and AUC values, indicating their capability in discriminating between positive and negative samples. The evaluation metrics exhibit consistent distribution, with specificity being the lowest, which may be attributed to the presence of false negatives in the non-enhancer sequences. Nevertheless, all models possess sufficient capability to predict whether a sequence is an enhancer, demonstrating the reliability of our construction of the original training data. These findings support the effectiveness and feasibility of the proposed method and highlight the robustness of the features and patterns learned by the deep learning models during the training process. The robust performance of the models suggests their potential applications in predicting enhancer sequences and advancing our understanding of gene expression regulation.
Figure 6
Figure 6
AUC Curves of Different Models. AUC score (Model 1 = 0.939438503, Model 2 = 0.944208139, Model 3 = 0.94386183, Model 3 = 0.940875633, Model 3 = 0.94601431, Ensemble Model = 0.948383796). A higher AUC score signifies that the model performs better across the entire range of decision thresholds, demonstrating its strong discriminative capability and overall effectiveness in distinguishing between positive and negative samples.

Similar articles

Cited by

References

    1. Schmitz R.J., Grotewold E., Stam M. Cis-regulatory sequences in plants: Their importance, discovery, and future challenges. Plant Cell. 2021;34:718–741. doi: 10.1093/plcell/koab281. - DOI - PMC - PubMed
    1. Beagan J.A., Pastuzyn E.D., Fernandez L.R., Guo M.H., Feng K., Titus K.R., Chandrashekar H., Shepherd J.D., Phillips-Cremins J.E. Three-dimensional genome restructuring across timescales of activity-induced neuronal gene expression. Nat. Neurosci. 2020;23:707–717. doi: 10.1038/s41593-020-0634-6. - DOI - PMC - PubMed
    1. Verheul T.C.J., van Hijfte L., Perenthaler E., Barakat T.S. The Why of YY1: Mechanisms of Transcriptional Regulation by Yin Yang 1. Front. Cell Dev. Biol. 2020;8:592164. doi: 10.3389/fcell.2020.592164. - DOI - PMC - PubMed
    1. Spitz F., Furlong E.E.M. Transcription factors: From enhancer binding to developmental control. Nat. Rev. Genet. 2012;13:613–626. doi: 10.1038/nrg3207. - DOI - PubMed
    1. Schoenfelder S., Fraser P. Long-range enhancer–promoter contacts in gene expression control. Nat. Rev. Genet. 2019;20:437–455. doi: 10.1038/s41576-019-0128-0. - DOI - PubMed

LinkOut - more resources