

Evaluation of Temozolomide and Fingolimod Treatments in Glioblastoma Preclinical Models
- PMID: 37760448
- PMCID: PMC10527257
- DOI: 10.3390/cancers15184478
Evaluation of Temozolomide and Fingolimod Treatments in Glioblastoma Preclinical Models
Abstract
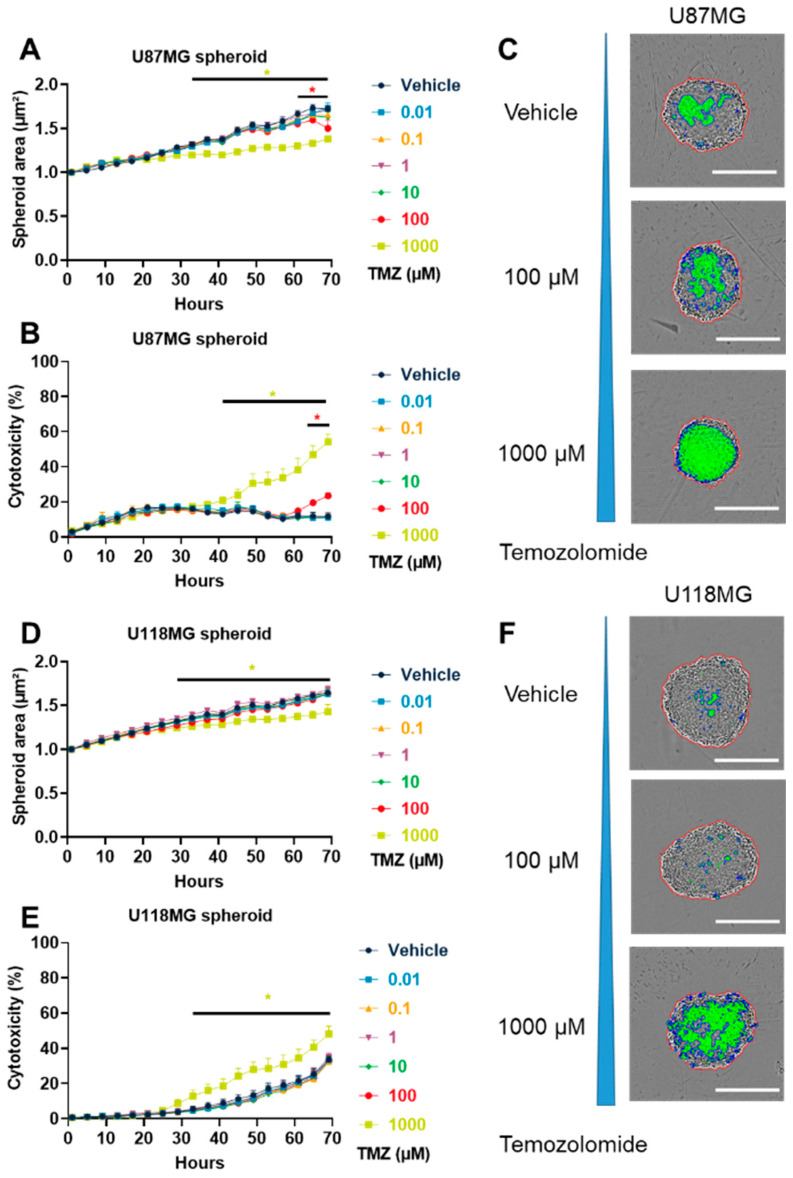
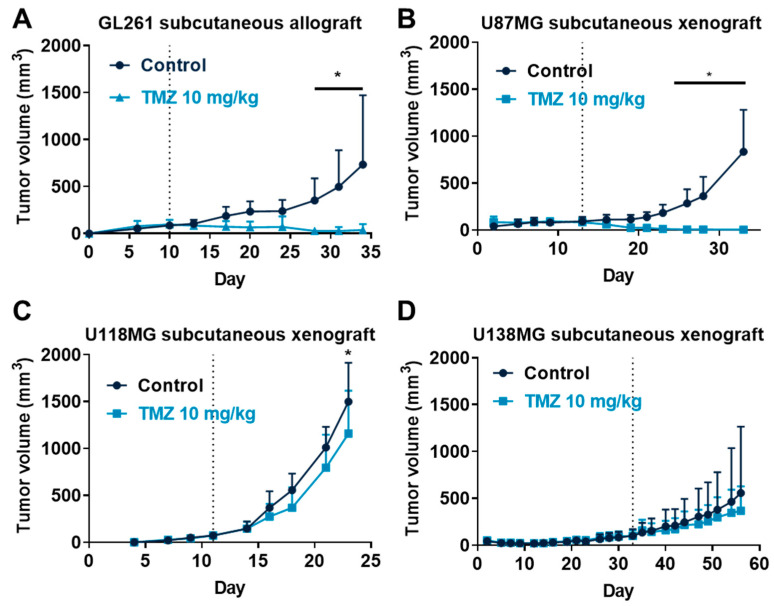
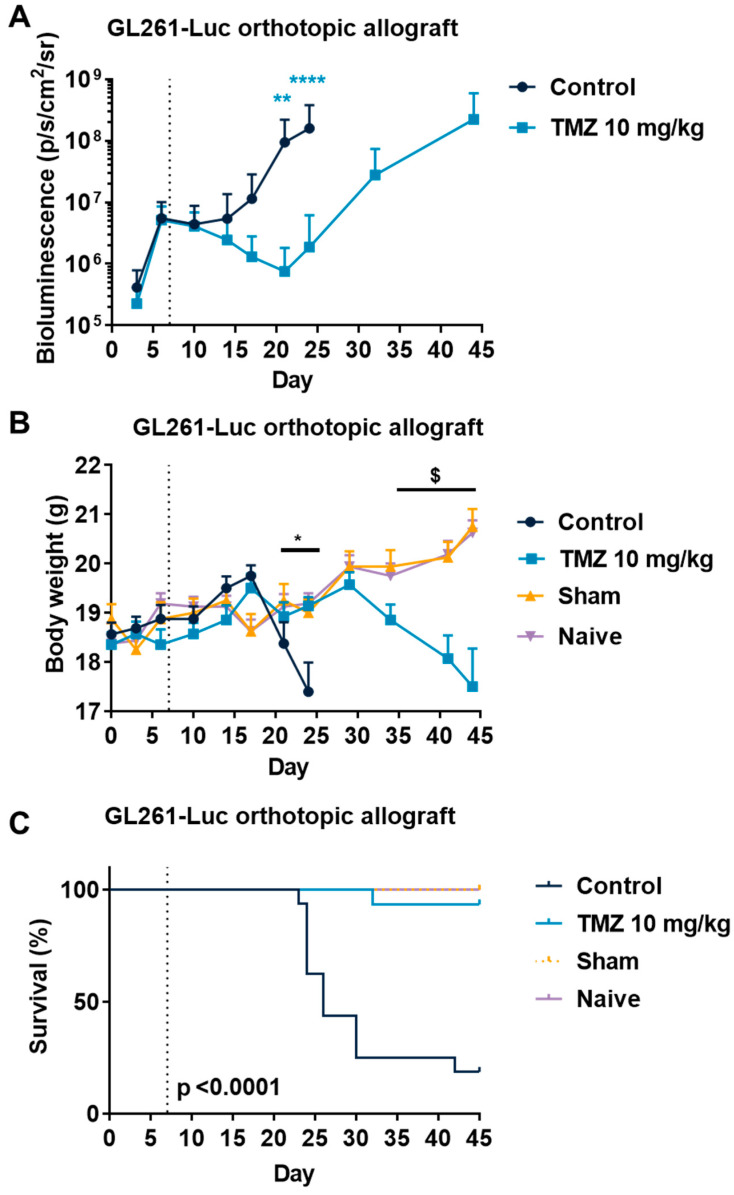
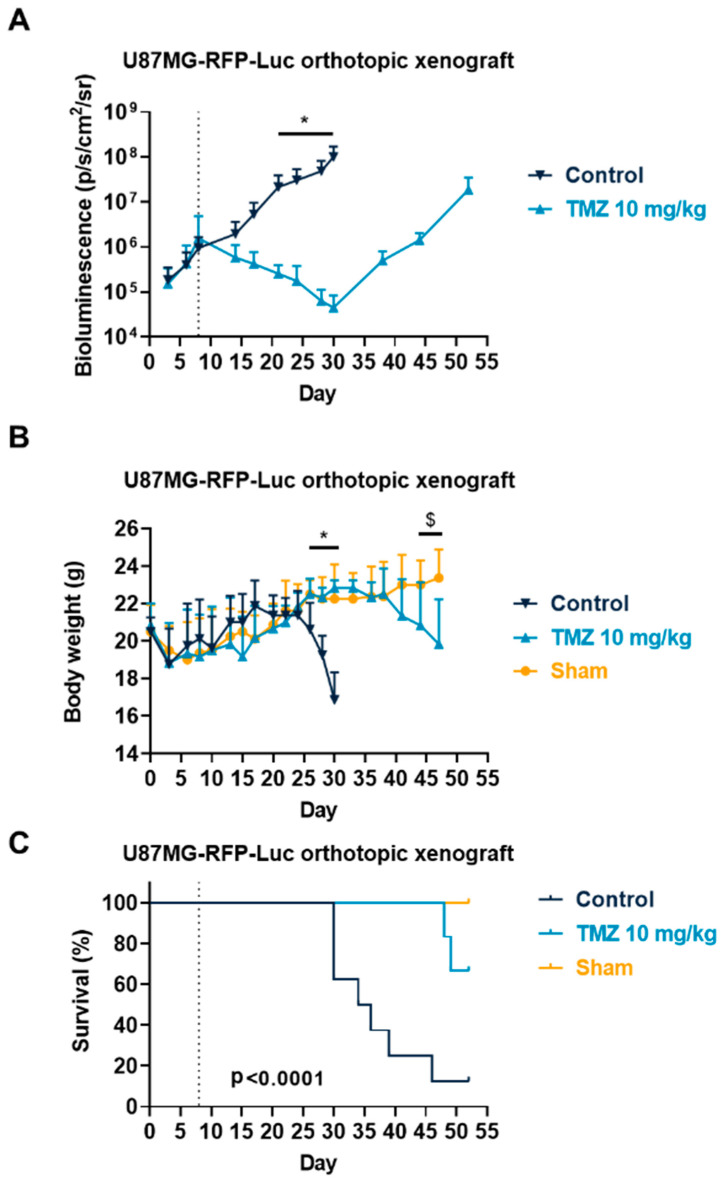
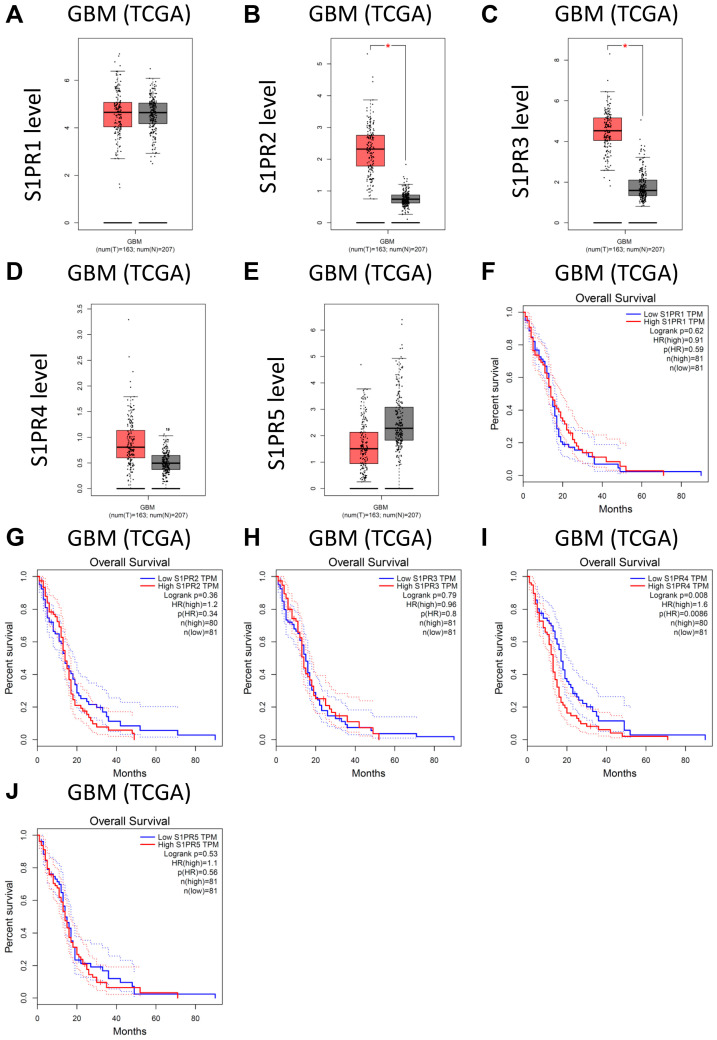
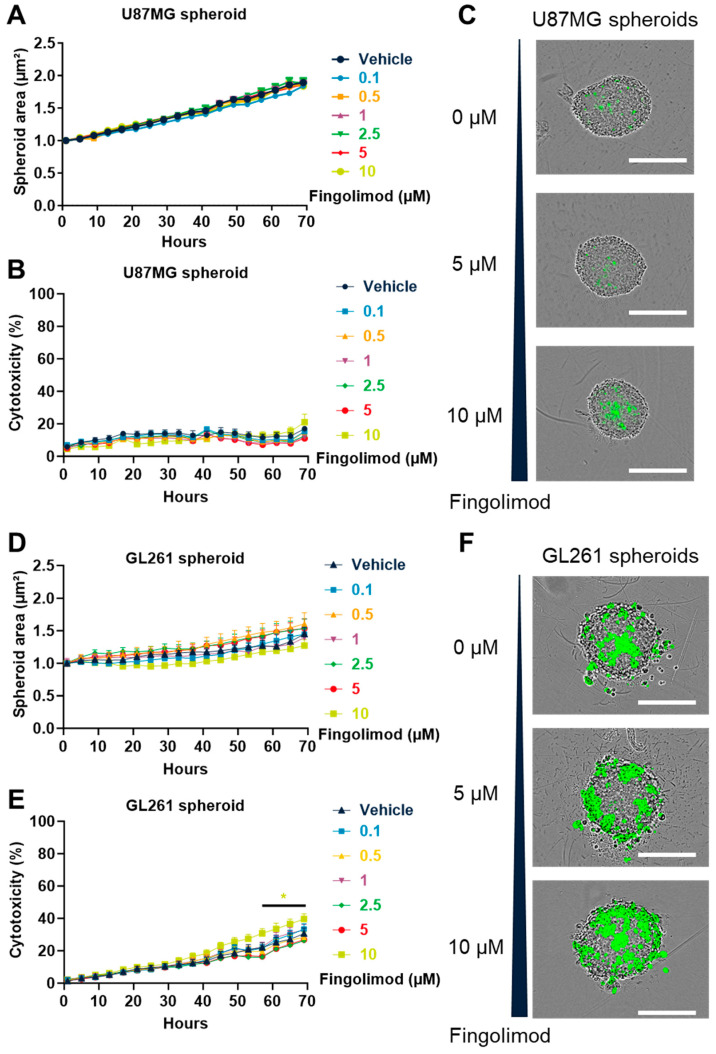
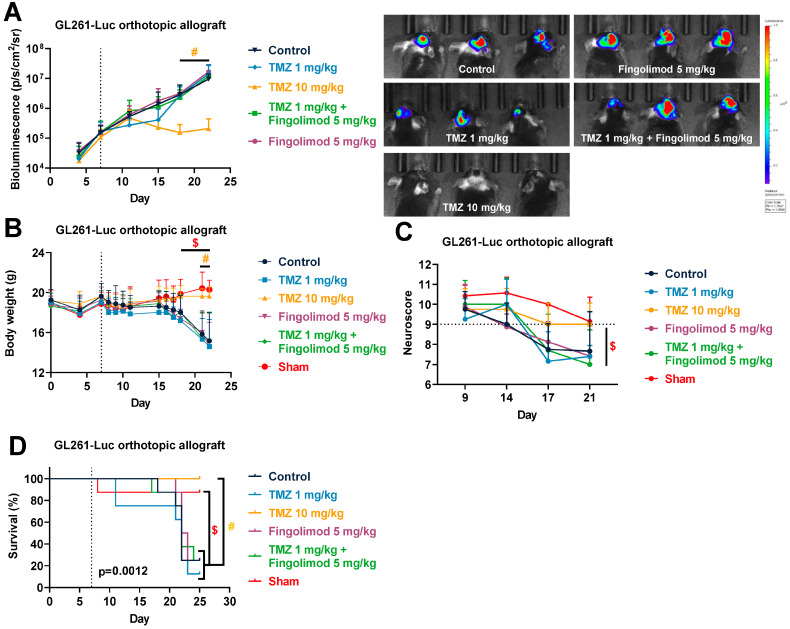
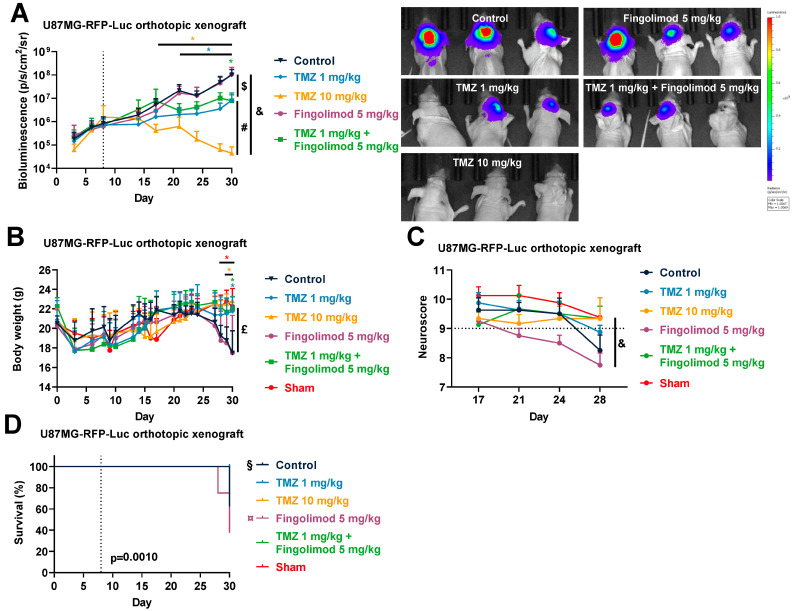
Glioblastomas are malignant brain tumors which remain lethal due to their aggressive and invasive nature. The standard treatment combines surgical resection, radiotherapy, and chemotherapy using Temozolomide, albeit with a minor impact on patient prognosis (15 months median survival). New therapies evaluated in preclinical translational models are therefore still required to improve patient survival and quality of life. In this preclinical study, we evaluated the effect of Temozolomide in different models of glioblastoma. We also aimed to investigate the efficacy of Fingolimod, an immunomodulatory drug for multiple sclerosis also described as an inhibitor of the sphingosine-1-phosphate (S1P)/S1P receptor axis. The effects of Fingolimod and Temozolomide were analyzed with in vitro 2D and 3D cellular assay and in vivo models using mouse and human glioblastoma cells implanted in immunocompetent or immunodeficient mice, respectively. We demonstrated both in in vitro and in vivo models that Temozolomide has a varied effect depending on the tumor type (i.e., U87MG, U118MG, U138MG, and GL261), demonstrating sensitivity, acquired resistance, and purely resistant tumor phenotypes, as observed in patients. Conversely, Fingolimod only reduced in vitro 2D tumor cell growth and increased cytotoxicity. Indeed, Fingolimod had little or no effect on 3D spheroid cytotoxicity and was devoid of effect on in vivo tumor progression in Temozolomide-sensitive models. These results suggest that the efficacy of Fingolimod is dependent on the glioblastoma tumor microenvironment. Globally, our data suggest that the response to Temozolomide varies depending on the cancer model, consistent with its clinical activity, whereas the potential activity of Fingolimod may merit further evaluation.
Keywords: Fingolimod; Temozolomide; brain cancer; glioblastoma; glioma; preclinical models; tumor progression.
Conflict of interest statement
The authors are or were all employees of Porsolt during this work. The authors declare no conflict of interest.
Figures
Similar articles
-
Therapeutic potential of Fingolimod in triple negative breast cancer preclinical models.Transl Oncol. 2021 Jan;14(1):100926. doi: 10.1016/j.tranon.2020.100926. Epub 2020 Nov 3. Transl Oncol. 2021. PMID: 33157518 Free PMC article.
-
Therapeutic Potential of Fingolimod and Dimethyl Fumarate in Non-Small Cell Lung Cancer Preclinical Models.Int J Mol Sci. 2022 Jul 25;23(15):8192. doi: 10.3390/ijms23158192. Int J Mol Sci. 2022. PMID: 35897763 Free PMC article.
-
Extracellular sphingosine-1-phosphate: a novel actor in human glioblastoma stem cell survival.PLoS One. 2013 Jun 24;8(6):e68229. doi: 10.1371/journal.pone.0068229. Print 2013. PLoS One. 2013. PMID: 23826381 Free PMC article.
-
Present and potential future adjuvant issues in high-grade astrocytic glioma treatment.Adv Tech Stand Neurosurg. 2009;34:3-35. doi: 10.1007/978-3-211-78741-0_1. Adv Tech Stand Neurosurg. 2009. PMID: 19368079 Review.
-
Temozolomide and treatment of malignant glioma.Clin Cancer Res. 2000 Jul;6(7):2585-97. Clin Cancer Res. 2000. PMID: 10914698 Review.
Cited by
-
Cell-Based Glioma Models for Anticancer Drug Screening: From Conventional Adherent Cell Cultures to Tumor-Specific Three-Dimensional Constructs.Cells. 2024 Dec 17;13(24):2085. doi: 10.3390/cells13242085. Cells. 2024. PMID: 39768176 Free PMC article. Review.
-
Therapeutic Potential of Fingolimod on Psychological Symptoms and Cognitive Function in Neuropsychiatric and Neurological Disorders.Neurochem Res. 2024 Oct;49(10):2668-2681. doi: 10.1007/s11064-024-04199-5. Epub 2024 Jun 26. Neurochem Res. 2024. PMID: 38918332 Review.
-
S100A11 is a potential prognostic biomarker and correlated with tumor immunosuppressive microenvironment in glioma.Medicine (Baltimore). 2024 Dec 20;103(51):e40701. doi: 10.1097/MD.0000000000040701. Medicine (Baltimore). 2024. PMID: 39705426 Free PMC article.
-
The sphingosine-1-phosphate signaling pathway (sphingosine-1-phosphate and its receptor, sphingosine kinase) and epilepsy.Epilepsia Open. 2025 Feb;10(1):55-73. doi: 10.1002/epi4.13112. Epub 2024 Dec 27. Epilepsia Open. 2025. PMID: 39727628 Free PMC article. Review.
-
The Molecular Chaperone TCP1 Affects Carcinogenicity and Is a Potential Therapeutic Target for Acute Myeloid Leukemia.Pharmaceutics. 2025 Apr 24;17(5):557. doi: 10.3390/pharmaceutics17050557. Pharmaceutics. 2025. PMID: 40430849 Free PMC article.
References
-
- Ostrom Q.T., Gittleman H., Fulop J., Liu M., Blanda R., Kromer C., Wolinsky Y., Kruchko C., Barnholtz-Sloan J.S. CBTRUS Statistical Report: Primary Brain and Central Nervous System Tumors Diagnosed in the United States in 2008–2012. Neuro-Oncology. 2015;17:iv1–iv62. doi: 10.1093/neuonc/nov189. - DOI - PMC - PubMed
-
- Fabbro-Peray P., Zouaoui S., Darlix A., Fabbro M., Pallud J., Rigau V., Mathieu-Daude H., Bessaoud F., Bauchet F., Riondel A., et al. Association of Patterns of Care, Prognostic Factors, and Use of Radiotherapy–Temozolomide Therapy with Survival in Patients with Newly Diagnosed Glioblastoma: A French National Population-Based Study. J. Neuro-Oncol. 2019;142:91–101. doi: 10.1007/s11060-018-03065-z. - DOI - PMC - PubMed
-
- Stupp R., Hegi M.E., Mason W.P., van den Bent M.J., Taphoorn M.J., Janzer R.C., Ludwin S.K., Allgeier A., Fisher B., Belanger K., et al. Effects of Radiotherapy with Concomitant and Adjuvant Temozolomide versus Radiotherapy Alone on Survival in Glioblastoma in a Randomised Phase III Study: 5-Year Analysis of the EORTC-NCIC Trial. Lancet Oncol. 2009;10:459–466. doi: 10.1016/S1470-2045(09)70025-7. - DOI - PubMed
LinkOut - more resources
Full Text Sources
