. 2023 Sep 18;15(18):4619.
doi: 10.3390/cancers15184619.

Repurposing Clemastine to Target Glioblastoma Cell Stemness

Affiliations

Repurposing Clemastine to Target Glioblastoma Cell Stemness

Michael A Sun et al. Cancers (Basel). .

Abstract

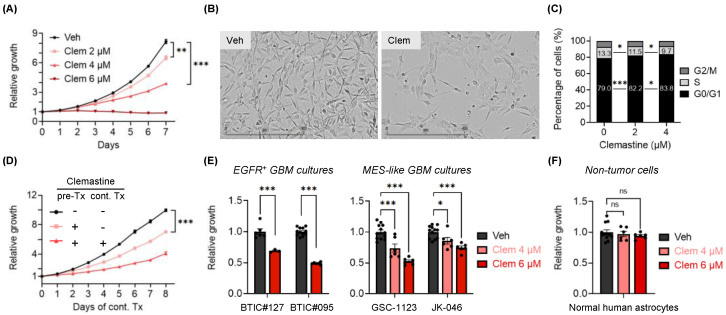
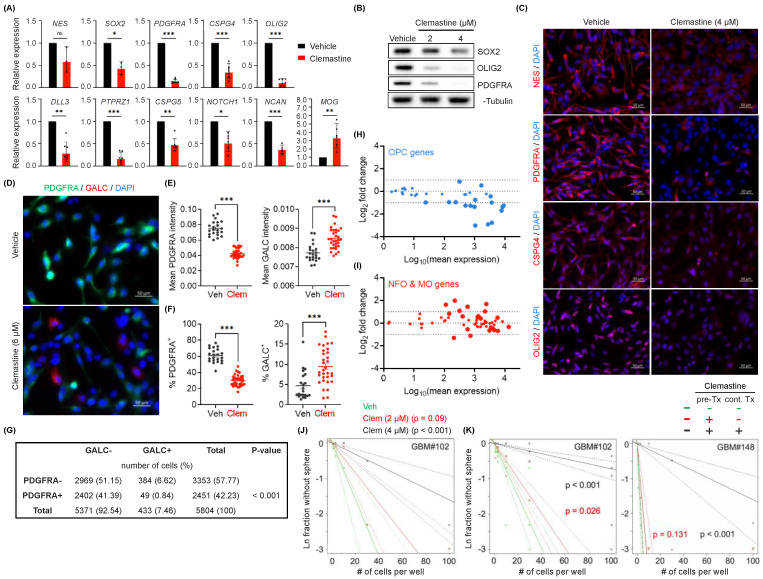
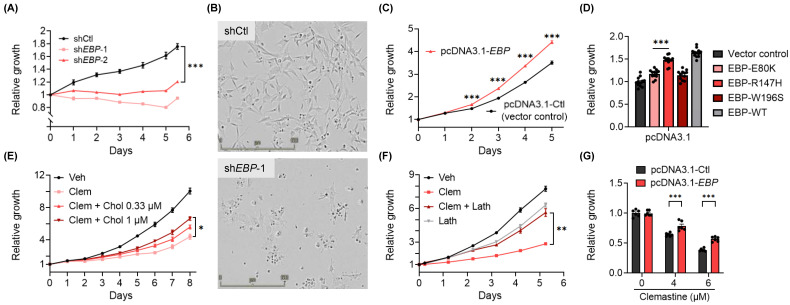
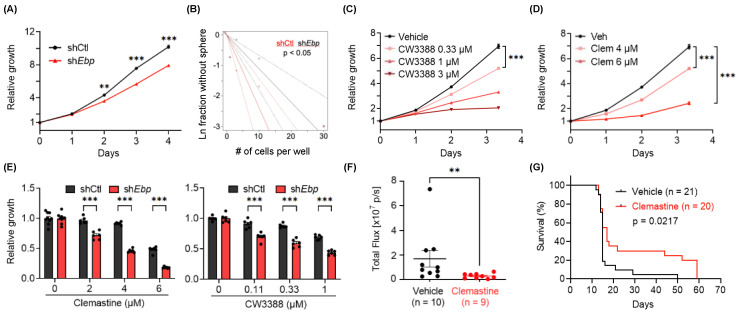
Brain tumor-initiating cells (BTICs) and tumor cell plasticity promote glioblastoma (GBM) progression. Here, we demonstrate that clemastine, an over-the-counter drug for treating hay fever and allergy symptoms, effectively attenuated the stemness and suppressed the propagation of primary BTIC cultures bearing PDGFRA amplification. These effects on BTICs were accompanied by altered gene expression profiling indicative of their more differentiated states, resonating with the activity of clemastine in promoting the differentiation of normal oligodendrocyte progenitor cells (OPCs) into mature oligodendrocytes. Functional assays for pharmacological targets of clemastine revealed that the Emopamil Binding Protein (EBP), an enzyme in the cholesterol biosynthesis pathway, is essential for BTIC propagation and a target that mediates the suppressive effects of clemastine. Finally, we showed that a neural stem cell-derived mouse glioma model displaying predominantly proneural features was similarly susceptible to clemastine treatment. Collectively, these results identify pathways essential for maintaining the stemness and progenitor features of GBMs, uncover BTIC dependency on EBP, and suggest that non-oncology, low-toxicity drugs with OPC differentiation-promoting activity can be repurposed to target GBM stemness and aid in their treatment.

Keywords: Emopamil Binding Protein (EBP); clemastine; glioblastoma; stemness.


Conflict of interest statement

The authors declare no conflict of interest.

Figures

Figure 1
Figure 1
Clemastine suppresses the propagation of patient-derived BTIC cultures. (A) Proliferation of BTIC#102 cells treated with clemastine (Clem) at indicated doses. n = 3 per condition except vehicle, n = 9. (B) Representative images (4×, scale bar: 400 µm) of BTIC#102 cells treated with vehicle (Veh) or clemastine (Clem; at 4 µM) for 20 days in laminin-coated plates. (C) Quantification of cell cycle analysis of BTIC#102 cells treated with clemastine at indicated doses for 12 days. n = 2 per condition. (D) Proliferation of BTIC#102 cells with or without 10-day clemastine (4 µM) pre-treatments (pre-Tx) and/or subsequent clemastine (4 µM) treatments (cont. Tx). Cell proliferation was monitored during subsequent clemastine treatments. n = 9 per condition except for the pre-Tx+cont.Tx+ group, n = 6. “-“: no clemastine in the media; “+”: with clemastine in the media. (E,F) Quantification of relative cell proliferation of BTICs bearing EGFR amplification (E, left panel), or features of mesenchymal (MES) subtypes (E, right panel), or (F) normal human astrocytes treated with clemastine (Clem) at indicated doses. The y-axis represents normalized phase area confluence at day 4 (normalized to day 0 and then normalized to respective vehicle controls). n = 12 for all vehicle groups except BTIC#127, n = 6; n = 6 for all drug-treated groups except BTIC#127, n =3. (A, DF) Data are represented as mean ± S.E.M. Significance was calculated using two-way repeated measures ANOVA followed by (A) Dunnett’s or (D) Tukey’s multiple comparisons tests or two-way ANOVA followed by (C) Tukey’s or (E,F) Sidak’s multiple comparisons tests, and was represented as * p < 0.05, ** p < 0.01, *** p < 0.001, ns: not significant.
Figure 2
Figure 2
Clemastine attenuates the stemness and progenitor cell features of PDGFRA+ BTICs. (A) mRNA expression levels of genes associated with NSCs, OPCs, oligodendrocytes, and suppressors of OPC differentiation in BTIC#102 cells treated with vehicle or clemastine (4 µM) for 9–15 days as assessed by quantitative RT-PCR. n = 7 per gene except MOG, CSPG5, and NOTCH1, n = 6, NCAN, n = 5, and NES, SOX2, n = 3. (B,C) Protein levels of NSC and OPC markers in BTIC#102 cells treated with clemastine at indicated doses for 13–14 days were assessed by (B) immunoblot assays (representative results from three independent experiments) or (C) immunofluorescence (IF) staining (representative images from two independent experiments; 20×, scale bar: 50 µm). (DG) IF staining of PDGFRA and GALC in BTIC#102 cells treated with vehicle or clemastine (Clem; at 6 µM) for 26 days. (D) Representative IF images (20×, scale bar: 50 µm), (E) quantification of mean PDGFRA and GALC fluorescence intensities, and (F) percentages of PDGFRA+ and GALC+ cells of the vehicle and clemastine-treated groups. (E,F) Each data point was calculated from a different field of view. n = 22 fields of view for all vehicle groups, and n = 32 for all clemastine-treated groups. (G) The contingency table of PDGFRA−/+ and/or GALC−/+ cell counts to assess the mutual exclusivity of PDGFRA and GALC positivity. A total of 5804 cells were identified from 54 fields of view. (H,I) MA plots summarizing differential mRNA expression of top 40 (H) OPC-specific genes or (I) oligodendrocytes-specific genes between clemastine versus vehicle-treated (15-day treatment) BTIC#102 cells. Larger symbols indicate genes with adjusted p-values < 0.05. (J) Extreme limiting dilution analysis (ELDA) of BTIC#102 cells treated with clemastine (Clem) at indicated doses for 14 days to assess their renewal capacity. p-values indicate significance between vehicle and clemastine-treated groups. (K) ELDA of BTIC#102 (left panel) and BTIC#148 (right panel) cells with or without 15-day clemastine (4 µM) pre-treatments (pre-Tx) and/or subsequent two-week clemastine (4 µM) treatments (cont. Tx). p-values indicate significance between the pre-Txcont. Tx group and other groups. n = 4 per condition. “-“: no clemastine in the media; “+” with clemastine in the media. Data are represented as (A) geometric mean ± geometric S.D. of fold change relative to vehicle-treated groups or (E,F) mean ± S.E.M. (E,F) Significance was calculated using unpaired t tests (F left panel with Welch’s correction) and represented as * p < 0.05, ** p < 0.01, *** p < 0.001, ns: not significant.
Figure 3
Figure 3
EBP is essential for BTIC proliferation, and the inhibition of EBP contributes to the suppressive effects of clemastine on BTICs. (A) Proliferation of non-targeting shRNA control (shCtl) and two non-overlapping EBP shRNA (shEBP-1 and shEBP-2) BTIC#102 cells 24 h after lentiviral transduction. n = 6 per condition. (B) Representative images (4×, scale bar: 500 µm) of shCtl and shEBP-1 BTIC#102 cells 9 days after lentiviral transduction. (C) Proliferation of vector control (pcDNA3.1-Ctl) and EBP-overexpressed (pcDNA3.1-EBP) BTIC#102 cells. p-values indicate significance between the two groups at indicated timepoints. n = 6 per condition. (D) Quantification of relative cell proliferation of BTIC#102 cells with vector control, overexpression of wild-type EBP, or overexpression of each of the three mutant EBPs. The y-axis represents normalized phase area confluence at day 6 (normalized to day 0 and then normalized to respective vehicle controls). n = 12 per condition. (E) Proliferation of BTIC#102 cells treated with clemastine (Clem; at 6 µM) with or without water-soluble cholesterol (Chol) at indicated doses. n = 4 per condition. (F) Proliferation of BTIC#102 cells treated with clemastine (Clem; at 6 µM) and/or lathosterol (Lath; at 6.25 µM). n = 6 per condition. (G) Quantification of relative cell proliferation of vector control and EBP-overexpressed BTIC#102 cells treated with clemastine at indicated doses. The y-axis represents normalized phase area confluence at day 4 (normalized to day 0 and then normalized to respective vehicle controls). n = 6 per condition. (A, CG) Data are represented as mean ± S.E.M. Significance was calculated using two-way repeated measures ANOVA followed by (A) Dunnett’s, (C) Sidak’s, or (E,F) Tukey’s multiple comparisons tests, (D) ordinary one-way ANOVA followed by Dunnett’s multiple comparisons tests, or (G) two-way ANOVA followed by Sidak’s multiple comparisons tests, and was represented as * p < 0.05, ** p < 0.01, *** p < 0.001.
Figure 4
Figure 4
Genetic knockdown and small-molecule inhibition of Ebp suppress the growth of C266 mouse glioma cells in vitro and in vivo. (A) Proliferation of non-targeting shRNA control (shCtl) or Ebp shRNA (shEbp) C266 cells 12 days after lentiviral transduction. p-values indicate significance between the two groups at indicated timepoints. n = 18 per condition. (B) ELDA of shCtl and shEbp C266 cells to assess their self-renewal capacity. (C) Proliferation of C266 cells treated with CW3388 at indicated doses. n = 6 per condition except vehicle, n = 12. (D) Proliferation of C266 cells treated with clemastine (Clem) at indicated doses. n = 6 per condition except vehicle, n = 12. (E) Quantification of relative cell proliferation of shCtl and shEbp C266 cells treated with clemastine (left panel) or CW3388 (right panel) at indicated doses. The y-axis represents normalized phase area confluence at day 4 (normalized to day 0 and then normalized to respective vehicle controls). n = 6 per condition except for all vehicle groups of the clemastine-treated panel, n = 9. (F,G) In vivo orthotopic mouse models derived from C266 cells treated with vehicle (30% DMSO in PBS) or clemastine (30 mg/kg) five times per week. (F) Quantification of tumor sizes 7 days after the first treatment by in vivo bioluminescent imaging and (G) Kaplan–Meier analyses. (G) Day 0 on the x-axis indicates the treatment start date. (A, CF) Data are represented as mean ± S.E.M. Significance was calculated using two-way repeated measures ANOVA followed by (A) Sidak’s or (C,D) Dunnett’s multiple comparisons tests, (E) two-way ANOVA followed by Sidak’s multiple comparisons tests, (F) Mann–Whitney tests, and was represented as ** p < 0.01, *** p < 0.001.

Similar articles

Cited by

  • A longitudinal single-cell and spatial multiomic atlas of pediatric high-grade glioma.
    Sussman JH, Oldridge DA, Yu W, Chen CH, Zellmer AM, Rong J, Parvaresh-Rizi A, Thadi A, Xu J, Bandyopadhyay S, Sun Y, Wu D, Emerson Hunter C, Brosius S, Ahn KJ, Baxter AE, Koptyra MP, Vanguri RS, McGrory S, Resnick AC, Storm PB, Amankulor NM, Santi M, Viaene AN, Zhang N, Raedt T, Cole K, Tan K. Sussman JH, et al. bioRxiv [Preprint]. 2024 Mar 8:2024.03.06.583588. doi: 10.1101/2024.03.06.583588. bioRxiv. 2024. PMID: 38496580 Free PMC article. Preprint.

References

    1. Galli R., Binda E., Orfanelli U., Cipelletti B., Gritti A., De Vitis S., Fiocco R., Foroni C., Dimeco F., Vescovi A. Isolation and characterization of tumorigenic, stem-like neural precursors from human glioblastoma. Cancer Res. 2004;64:7011–7021. doi: 10.1158/0008-5472.CAN-04-1364. - DOI - PubMed
    1. Ignatova T.N., Kukekov V.G., Laywell E.D., Suslov O.N., Vrionis F.D., Steindler D.A. Human cortical glial tumors contain neural stem-like cells expressing astroglial and neuronal markers in vitro. Glia. 2002;39:193–206. doi: 10.1002/glia.10094. - DOI - PubMed
    1. Singh S.K., Clarke I.D., Terasaki M., Bonn V.E., Hawkins C., Squire J., Dirks P.B. Identification of a cancer stem cell in human brain tumors. Cancer Res. 2003;63:5821–5828. - PubMed
    1. Singh S.K., Hawkins C., Clarke I.D., Squire J.A., Bayani J., Hide T., Henkelman R.M., Cusimano M.D., Dirks P.B. Identification of human brain tumour initiating cells. Nature. 2004;432:396–401. doi: 10.1038/nature03128. - DOI - PubMed
    1. Hemmati H.D., Nakano I., Lazareff J.A., Masterman-Smith M., Geschwind D.H., Bronner-Fraser M., Kornblum H.I. Cancerous stem cells can arise from pediatric brain tumors. Proc. Natl. Acad. Sci. USA. 2003;100:15178–15183. doi: 10.1073/pnas.2036535100. - DOI - PMC - PubMed