. 2023 Sep 21;15(18):4662.
doi: 10.3390/cancers15184662.

MRI Assessment of Changes in Tumor Vascularization during Neoadjuvant Anti-Angiogenic Treatment in Locally Advanced Breast Cancer Patients

Affiliations

MRI Assessment of Changes in Tumor Vascularization during Neoadjuvant Anti-Angiogenic Treatment in Locally Advanced Breast Cancer Patients

Torgeir Mo et al. Cancers (Basel). .

Abstract

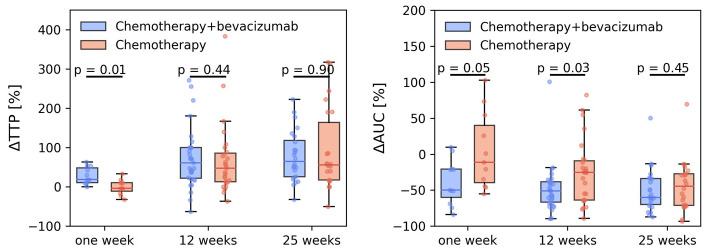
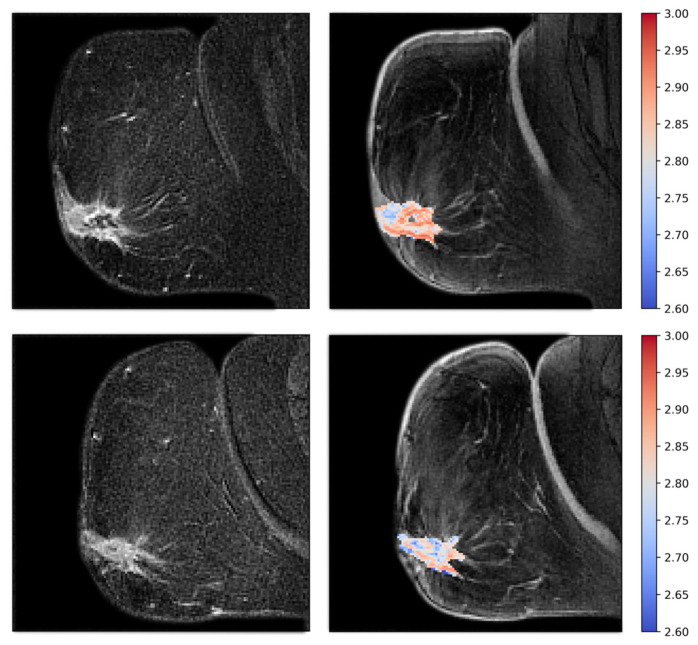
Anti-VEGF (vascular endothelial growth factor) treatment improves response rates, but not progression-free or overall survival in advanced breast cancer. It has been suggested that subgroups of patients may benefit from this treatment; however, the effects of adding anti-VEGF treatment to a standard chemotherapy regimen in breast cancer patients are not well studied. Understanding the effects of the anti-vascular treatment on tumor vasculature may provide a selection of patients that can benefit. The aim of this study was to study the vascular effect of bevacizumab using clinical dynamic contrast-enhanced MRI (DCE-MRI). A total of 70 women were randomized to receive either chemotherapy alone or chemotherapy with bevacizumab for 25 weeks. DCE-MRI was performed at baseline and at 12 and 25 weeks, and in addition 25 of 70 patients agreed to participate in an early MRI after one week. Voxel-wise pharmacokinetic analysis was performed using semi-quantitative methods and the extended Tofts model. Vascular architecture was assessed by calculating the fractal dimension of the contrast-enhanced images. Changes during treatment were compared with baseline and between the treatment groups. There was no significant difference in tumor volume at any point; however, DCE-MRI parameters revealed differences in vascular function and vessel architecture. Adding bevacizumab to chemotherapy led to a pronounced reduction in vascular DCE-MRI parameters, indicating decreased vascularity. At 12 and 25 weeks, the difference between the treatment groups is severely reduced.

Keywords: angiogenesis inhibitors; breast neoplasms; fractals; magnetic resonance imaging; neoadjuvant therapy; pharmacokinetics.


Conflict of interest statement

The authors declare no conflict of interest.

Figures

Figure 1
Figure 1
Relative change in MRI-derived tumor volumes after 1, 12, and 25 weeks for the two treatment groups.
Figure 2
Figure 2
Probability density plots of time-to-peak (TTP) and area under the contrast curve (AUC) for individual breast tumor voxels during treatment with neoadjuvant chemotherapy-only (n = 32) or chemotherapy + bevacizumab (n = 38).
Figure 3
Figure 3
Relative change in time-to-peak (TTP) and area under the contrast curve (AUC) after 1, 12, and 25 weeks for breast cancer patients who received neoadjuvant treatment with chemotherapy-only or chemotherapy + bevacizumab. All changes are normalized to individual pretreatment values.
Figure 4
Figure 4
Probability density plots of Ktrans, kep, ve and vp from the extended Tofts model for individual breast tumor voxels during treatment with neoadjuvant chemotherapy-only (control, n = 32) or neoadjuvant chemotherapy + bevacizumab (bevacizumab, n = 38).
Figure 5
Figure 5
Relative change in Ktrans, kep, ve, and vp after 1, 12, and 25 weeks for the breast cancer patients who received neoadjuvant treatment with chemotherapy (controls, n = 32) or chemotherapy + bevacizumab (bevacizumab, n = 38). All changes are normalized to individual pretreatment values.
Figure 6
Figure 6
Patient treated with bevacizumab showing intermediate pre-treatment fractal dimension (top), with a significant increase in fractal dimensionality after one week of treatment (bottom). The fractal dimension maps are shown to the right as colored overlays on T2-weighted images. To the left are the subtraction images that the fractal dimension is calculated from.
Figure 7
Figure 7
Patient treated with bevacizumab, showing high pretreatment fractal dimension (top), with a significant reduction after one week of treatment (bottom). Fractal dimension maps are shown to the right, and subtraction images are shown to the left.
Figure 8
Figure 8
Relative change in the fractal dimensionality of the subtraction images in the breast cancer patients who received neoadjuvant treatment with chemotherapy (controls, n = 32) or chemotherapy + bevacizumab (bevacizumab, n = 38).

References

    1. Ayoub N.M., Jaradat S.K., Al-Shami K.M., Alkhalifa A.E. Targeting Angiogenesis in Breast Cancer: Current Evidence and Future Perspectives of Novel Anti-Angiogenic Approaches. Front. Pharmacol. 2022;13:838133. doi: 10.3389/fphar.2022.838133. - DOI - PMC - PubMed
    1. Tanne J.H. FDA cancels approval for bevacizumab in advanced breast cancer. BMJ. 2011;343:d7684. doi: 10.1136/bmj.d7684. - DOI - PubMed
    1. Bergers G., Benjamin L.E. Tumorigenesis and the angiogenic switch. Nat. Rev. Cancer. 2003;3:401–410. doi: 10.1038/nrc1093. - DOI - PubMed
    1. Kümler I., Christiansen O.G., Nielsen D.L. A systematic review of bevacizumab efficacy in breast cancer. Cancer Treat. Rev. 2014;40:960–973. doi: 10.1016/j.ctrv.2014.05.006. - DOI - PubMed
    1. Fakhrejahani E., Toi M. Antiangiogenesis Therapy for Breast Cancer: An Update and Perspectives from Clinical Trials. Jpn. J. Clin. Oncol. 2014;44:197–207. doi: 10.1093/jjco/hyt201. - DOI - PMC - PubMed

LinkOut - more resources