

High Hepcidin Levels Promote Abnormal Iron Metabolism and Ferroptosis in Chronic Atrophic Gastritis
- PMID: 37760781
- PMCID: PMC10525531
- DOI: 10.3390/biomedicines11092338
High Hepcidin Levels Promote Abnormal Iron Metabolism and Ferroptosis in Chronic Atrophic Gastritis
Abstract
Background: Chronic atrophic gastritis (CAG) is a chronic inflammatory disease and premalignant lesion of gastric cancer. As an antimicrobial peptide, hepcidin can maintain iron metabolic balance and is susceptible to inflammation.
Objectives: The objective of this study was to clarify whether hepcidin is involved in abnormal iron metabolism and ferroptosis during CAG pathogenesis.
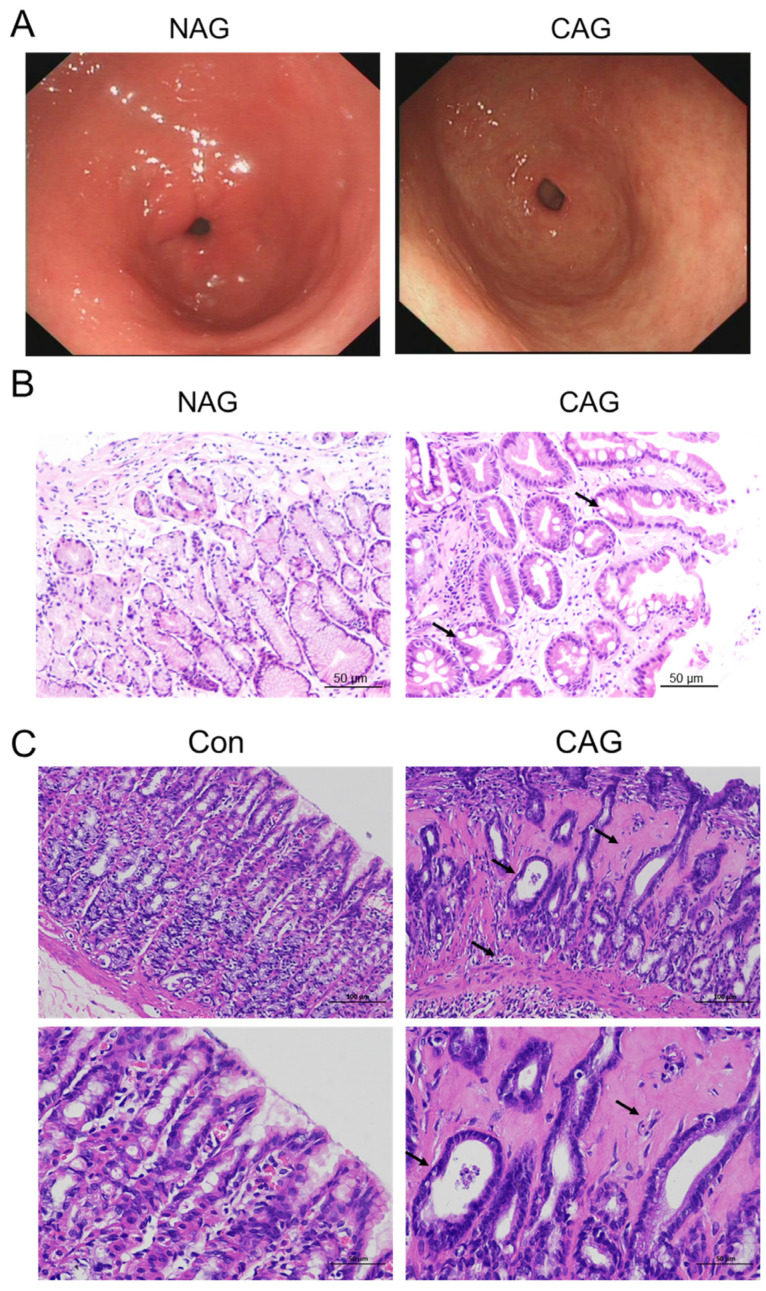
Methods: Non-atrophic gastritis (NAG) and chronic atrophic gastritis (CAG) patient pathology slides were collected, and related protein expression was detected by immunohistochemical staining. The CAG rat model was established using MNNG combined with an irregular diet.
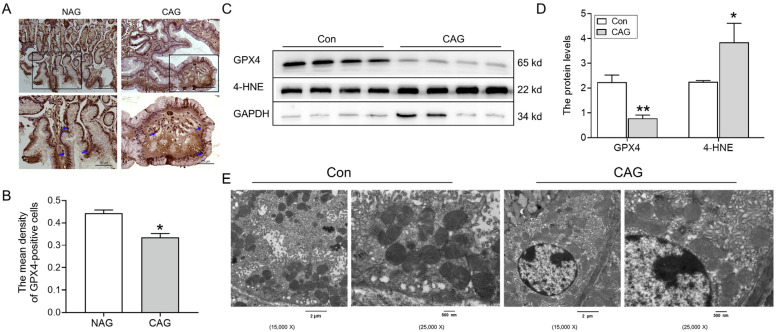
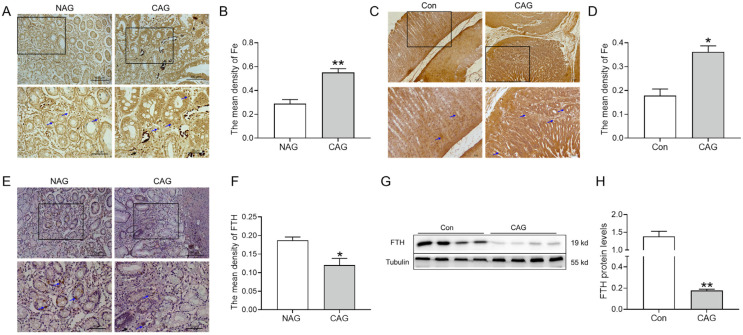
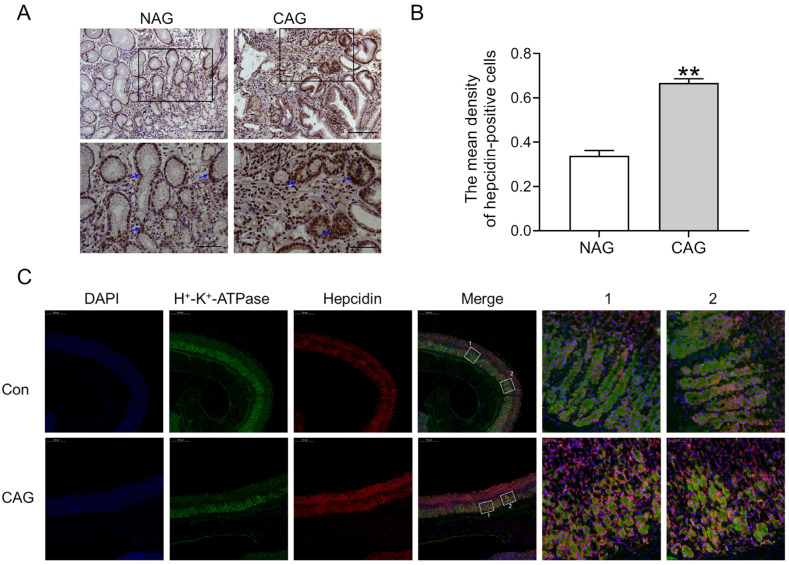
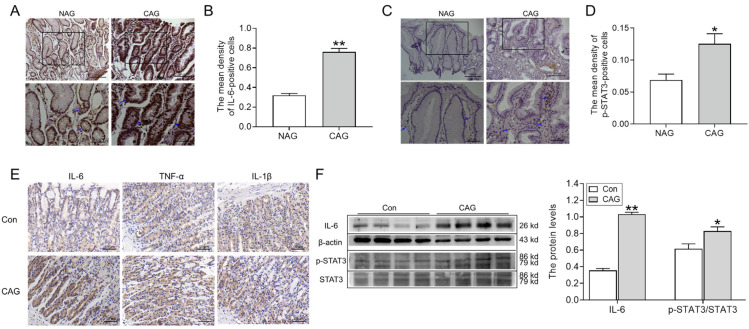
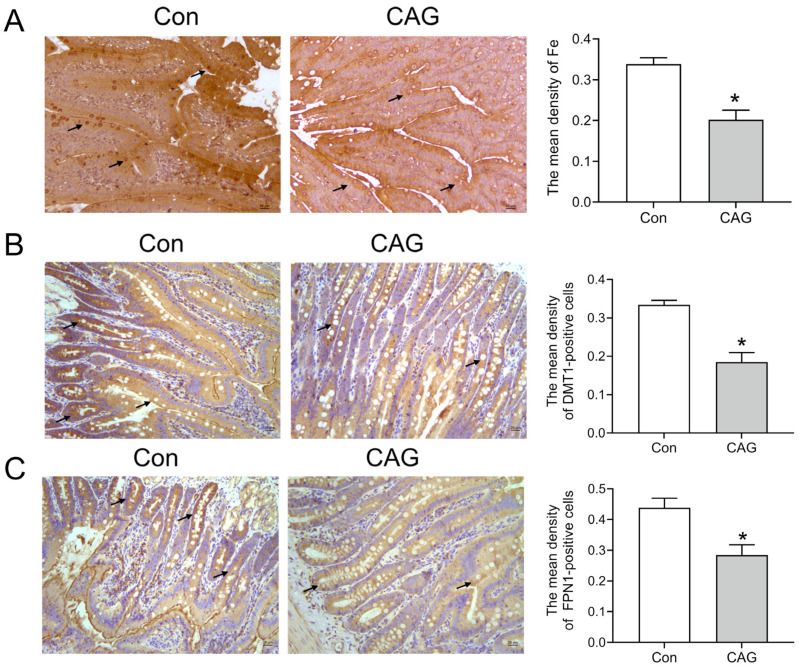
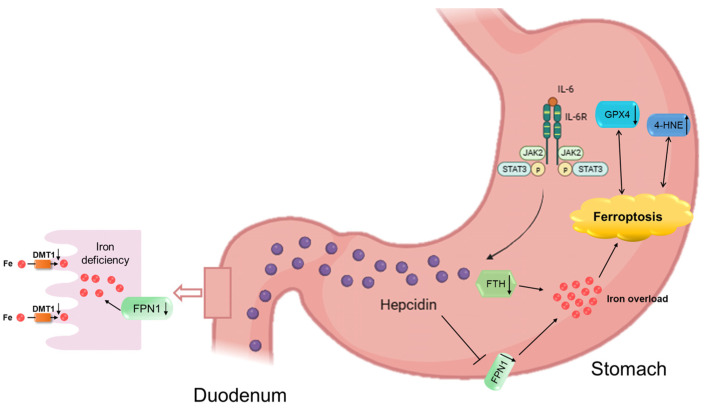
Results: CAG patients and rats exhibited iron deposition in gastric tissue. CAG-induced ferroptosis in the stomach was characterized by decreased GPX4 and FTH levels and increased 4-HNE levels. Hepcidin, which is mainly located in parietal cells, was elevated in CAG gastric tissue. The high gastric level of hepcidin inhibited iron absorption in the duodenum by decreasing the protein expression of DMT1 and FPN1. In addition, the IL-6/STAT3 signaling pathway induced hepcidin production in gastric tissue.
Conclusion: Our results showed that the high level of gastric hepcidin induced ferroptosis in the stomach but also inhibited iron absorption in the intestines. Inhibiting hepcidin might be a new strategy for the prevention of CAG in the future.
Keywords: IL-6/STAT3 signaling pathway; chronic atrophic gastritis; ferroptosis; hepcidin; iron.
Conflict of interest statement
The authors declare no conflict of interest.
Figures
Similar articles
-
Luteolin targets the AGE-RAGE signaling to mitigate inflammation and ferroptosis in chronic atrophic gastritis.Aging (Albany NY). 2024 Jun 24;16(13):10918-10930. doi: 10.18632/aging.205969. Epub 2024 Jun 24. Aging (Albany NY). 2024. PMID: 38917486 Free PMC article.
-
GADD45B regulates the carcinogenesis process of chronic atrophic gastritis and the metabolic pathways of gastric cancer.Front Endocrinol (Lausanne). 2023 Aug 7;14:1224832. doi: 10.3389/fendo.2023.1224832. eCollection 2023. Front Endocrinol (Lausanne). 2023. PMID: 37608794 Free PMC article.
-
Hepcidin Promoted Ferroptosis through Iron Metabolism which Is Associated with DMT1 Signaling Activation in Early Brain Injury following Subarachnoid Hemorrhage.Oxid Med Cell Longev. 2021 Dec 27;2021:9800794. doi: 10.1155/2021/9800794. eCollection 2021. Oxid Med Cell Longev. 2021. PMID: 34987706 Free PMC article.
-
Risk for gastric neoplasias in patients with chronic atrophic gastritis: a critical reappraisal.World J Gastroenterol. 2012 Mar 28;18(12):1279-85. doi: 10.3748/wjg.v18.i12.1279. World J Gastroenterol. 2012. PMID: 22493541 Free PMC article. Review.
-
Prevalence of chronic atrophic gastritis worldwide from 2010 to 2020: an updated systematic review and meta-analysis.Ann Palliat Med. 2022 Dec;11(12):3697-3703. doi: 10.21037/apm-21-1464. Ann Palliat Med. 2022. PMID: 36635994
Cited by
-
Mechanistic and Molecular Insights into Empagliflozin's Role in Ferroptosis and Inflammation Trajectories in Acetaminophen-Induced Hepatotoxicity.Pharmaceuticals (Basel). 2025 Mar 13;18(3):405. doi: 10.3390/ph18030405. Pharmaceuticals (Basel). 2025. PMID: 40143181 Free PMC article.
-
From bench to bedside: targeting ferroptosis and mitochondrial damage in the treatment of diabetic cardiomyopathy.Front Endocrinol (Lausanne). 2025 Apr 25;16:1563362. doi: 10.3389/fendo.2025.1563362. eCollection 2025. Front Endocrinol (Lausanne). 2025. PMID: 40352456 Free PMC article. Review.
-
Luteolin targets the AGE-RAGE signaling to mitigate inflammation and ferroptosis in chronic atrophic gastritis.Aging (Albany NY). 2024 Jun 24;16(13):10918-10930. doi: 10.18632/aging.205969. Epub 2024 Jun 24. Aging (Albany NY). 2024. PMID: 38917486 Free PMC article.
-
Unraveling Ferroptosis: A New Frontier in Combating Renal Fibrosis and CKD Progression.Biology (Basel). 2024 Dec 27;14(1):12. doi: 10.3390/biology14010012. Biology (Basel). 2024. PMID: 39857243 Free PMC article. Review.
-
Integrating network analysis and experimental validation to reveal the ferroptosis-associated mechanism of velvet antler in the treatment of chronic atrophic gastritis.J Food Drug Anal. 2025 Jun 13;33(2):119-131. doi: 10.38212/2224-6614.3546. J Food Drug Anal. 2025. PMID: 40592336 Free PMC article.
References
-
- Dănilă C., Cardos I.A., Pop-Crisan A., Marc F., Hoza A., Chirla R., Pascalău A., Magheru C., Cavalu S. Correlations between Endoscopic and Histopathological Assessment of Helicobacter pylori-Induced Gastric Pathology—A Cross-Sectional Retrospective Study. Life. 2022;12:2096. doi: 10.3390/life12122096. - DOI - PMC - PubMed
Grants and funding
LinkOut - more resources
Full Text Sources
Research Materials
Miscellaneous
