. 2023 Aug 24;11(9):2369.
doi: 10.3390/biomedicines11092369.

Identification of CD44 as a Reliable Biomarker for Glioblastoma Invasion: Based on Magnetic Resonance Imaging and Spectroscopic Analysis of 5-Aminolevulinic Acid Fluorescence

Affiliations

Identification of CD44 as a Reliable Biomarker for Glioblastoma Invasion: Based on Magnetic Resonance Imaging and Spectroscopic Analysis of 5-Aminolevulinic Acid Fluorescence

Akihiro Inoue et al. Biomedicines. .

Abstract

Recurrent glioblastoma multiforme (GBM) is largely attributed to peritumoral infiltration of tumor cells. As higher CD44 expression in the tumor periphery correlates with higher risk of GBM invasion, the present study analyzed the relationship between CD44 expression and magnetic resonance imaging (MRI)-based invasiveness of GBM on a large scale. We also quantitatively evaluated GBM invasion using 5-aminolevulinic acid (5-ALA) spectroscopy to investigate the relationship between CD44 expression and tumor invasiveness as evaluated by intraoperative 5-ALA intensity. Based on MRI, GBM was classified as high-invasive type in 28 patients and low-invasive type in 22 patients. High-invasive type expressed CD44 at a significantly higher level than low-invasive type and was associated with worse survival. To quantitatively analyze GBM invasiveness, the relationship between tumor density in the peritumoral area and the spectroscopic intensity of 5-ALA was investigated. Spectroscopy showed that the 5-ALA intensity of infiltrating tumor cells correlated with tumor density as represented by the Ki-67 staining index. No significant correlation between CD44 and degree of 5-ALA-based invasiveness of GBM was found, but invasiveness of GBM as evaluated by 5-ALA matched the classification from MRI in all except one case, indicating that CD44 expression at the GBM periphery could provide a reliable biomarker for invasiveness in GBM.

Keywords: 5-aminolevulinic acid; CD44; biomarker; fluorescence spectroscopy; glioblastoma; glioma stem cell; invasion.


Conflict of interest statement

The authors declare that there are no conflict of interest regarding the publication of this paper. None of the authors has any financial interest in this work.

Figures

Figure 1
Figure 1
Phenotypes of invasiveness in glioblastoma multiforme (GBM) based on the evaluation of imaging features on magnetic resonance imaging (MRI). GBM was classified into high-invasive (HI) and low-invasive (LI) phenotypes using four features on MRI (Table 1). (a) MRI (left: gadolinium-enhanced T1-weighted imaging; right: FLAIR) and illustration (far right) of HI-type GBM. (b) MRI and illustration of LI-type GBM.
Figure 2
Figure 2
Kaplan–Meier survival curves showing progression-free survival (PFS) and overall survival (OS) in 50 patients with GBM, including HI-type GBM (28 patients) and LI-type GBM (22 patients).
Figure 3
Figure 3
mRNA expression of CD44 in the tumor core and tumor periphery in 50 patients with GBM. Upper panel shows expression patterns of CD44 mRNA in GBM classified into HI-type tumor and LI-type tumor on MRI. Lower panel displays differences in types of GBM invasiveness between HI- and LI-type tumors. (a) CD44 expression in tumor core. (b) CD44 expression in tumor periphery. (c) CD44 expression as represented by P/C ratio (ratio of CD44 expression in tumor periphery to expression in tumor core). No significant difference in CD44 expression in the tumor core is seen between HI- and LI-type tumors (HI vs. LI: 3.55 ± 4.36 vs. 8.67 ± 13.7, p = 0.104). In contrast, in the tumor periphery, CD44 expression in HI-type tumors is significantly higher than that in LI-type tumors (HI vs. LI: 25.56 ± 16.83 vs. 9.14 ± 14.93, p = 0.0013). P/C ratios of CD44 expression disclose a much greater difference in CD44 expression between HI- and LI-type tumors than CD44 expression in the tumor periphery alone (HI vs. LI: 11.06 ± 7.0 vs. 1.62 ± 1.35, p = 0.0000003). These results coincide with sensitivity and specificity for predicting HI-type tumors (P/C ratio: 100% sensitivity, 83.8% specificity; expression in tumor periphery alone: 85.7% sensitivity, 79.2% specificity). (Cutoff values are displayed in CD44 expression patterns in the upper panel.)
Figure 4
Figure 4
Kaplan–Meier survival curves showing progression-free survival (PFS) and overall survival (OS) in 50 patients with GBM, including GBM with high CD44 expression (High P/C ratio) (25 patients) and GBM with low CD44 expression (Low P/C ratio) (25 patients). CD44 expression types were determined by the cutoff values of 5.38. Both PFS and OS were significantly longer in the patients with a low-CD44 expression type of GBM than those with a high-CD44 expression type of GBM (median (m) PFS: Low P/C ratio vs. High P/C ratio, 9.5 months (M) vs. 7 M, p = 0.02; mOS: Low P/C ratio vs. High P/C ratio, 25.0 M vs. 14.0 M, p = 0.0000025).
Figure 5
Figure 5
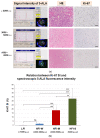
Spectroscopic intensity of 5-ALA fluorescence and its pathology in the target area. (a) Left panel: Spectroscopy of 5-ALA fluorescence showing the fluorescence spectrum and fluorescence intensity of the peak at a wavelength of around 636 nm and intraoperative views showing tumors with various shades of red color according to the strength of ALA-fluorescence signal intensity. Right panel: Histological images of hematoxylin and eosin staining and immunohistochemical staining with Ki-67 corresponding to strength of signal intensity shown in the left panels. Upper: Tissues at the tumor border show signal intensity ≥5000 a.u. containing numerous tumor cells and a mean Ki-67 LI of 32.8%. Middle: Tissues containing medium numbers of tumor cells with a mean Ki-67 SI of 18.4% under a signal intensity of 3000–5000 a.u. Lower: Tissues containing few tumor cells with a mean Ki-67 SI of 1.82% under a signal intensity of 1000–3000 a.u. In tissues showing signal intensity <1000 a.u., tumor cells are almost absent. Magnification, ×100. Scale bar, 100 µm. (b) A bar graph presenting the relationship between signal intensities of 5-ALA fluorescence and tumor density as represented by Ki-67 SI. The graph demonstrates that intensities of 5-ALA depend on the number of proliferating tumor cells as represented by Ki-67 SI. ** p < 0.01, *** p < 0.001, ns: not significant.
Figure 6
Figure 6
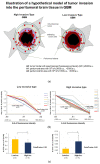
Quantitative evaluation of invasive types in GBM on 5-ALA fluorescence spectroscopy. (a) Illustration of a hypothetical model of tumor invasion into the peritumoral brain tissue in HI-type GBM and LI-type GBM. At the tumor border zone, massive numbers of tumor cells crowd the area around the tumor mass. This area is defined as A0. Around area A0, areas are expected to present less signal intensity of 5-ALA than A0. These areas are divided into two areas, with signal intensities of 3000–5000 a.u. (A1) and 1000–3000 a.u. (A2). Tissue samples were obtained from each area and histological examinations including immunostaining of Ki-67 were performed. (b) Attenuation curves of Ki-67 SI ratios at A1 and A2 compared to A0 in the group with fluorescence intensity <1000 a.u. at final tumor resection (six patients, corresponding to LI-type GBM) (left graph) and in the group with intensity ≥1000 a.u. at final tumor resection (15 patients, corresponding to HI-type GBM) (right graph). In LI-type GBM, all six patients show A1/A0 ratios greater than or equal to the cutoff value of 0.55 and A2/A0 ratios less than the cutoff value of 0.04. In HI-type GBM, 14 patients present A2/A0 ratios ≥0.04, except one patient (Patient 15). This patient displays an A1/A0 ratio of 0.67, and so was classified with LI type tumour, the same as the invasive type evaluated on MRI. Although Patient 10 had been classified with LI-type tumor on MRI, both Ki-67 SI ratios of A1/A0 and A2/A0 showed values corresponding to HI-type tumor. (c) Bar graphs showing differences in Ki-67 SI ratio at A1 (A1/A0) (left) and at A2 (A2/A0) (right) between HI-type GBM and LI-type GBM. Values at A1 are significantly higher in LI-type GBM than in HI-type GBM (LI vs. HI: 0.717 ± 0.118 vs. 0.548 ± 0.168, p = 0.038). The cutoff of 0.55 offers 100% sensitivity and 60% specificity. Values at A2 are significantly higher in HI-type GBM than in LI-type GBM (HI vs. LI: 0.077 ± 0.04 vs. 0.03 ± 0.01, p = 0.0115), with a cutoff of 0.04 offering 100% sensitivity and 93.1% specificity. (d) Kaplan–Meier survival curves show PFS and OS in 21 patients with GBM types classified as HI (14 patients, weakly high-invasive (HIw): 6, moderately high-invasive (HIm): 5, strongly high-invasive (HIs): (3) and LI (7 patients), for which invasive types were determined by spectroscopic analysis of 5-ALA fluorescence). Both PFS and OS were significantly longer in patients with an LI-type GBM than in those with HI-type GBM (median PFS: LI vs. HIw, HIm, and HIs: 15.7 months vs. 5.9 months, 9.0 months, and 4.0 months, p = 0.0014; median OS: LI vs. HIw, HIm, and HIs: 26.5 months vs. 8.4 months, 17.0 months, and 8.3 months, respectively, p = 0.0068). * p < 0.05.
Figure 6
Figure 6
Quantitative evaluation of invasive types in GBM on 5-ALA fluorescence spectroscopy. (a) Illustration of a hypothetical model of tumor invasion into the peritumoral brain tissue in HI-type GBM and LI-type GBM. At the tumor border zone, massive numbers of tumor cells crowd the area around the tumor mass. This area is defined as A0. Around area A0, areas are expected to present less signal intensity of 5-ALA than A0. These areas are divided into two areas, with signal intensities of 3000–5000 a.u. (A1) and 1000–3000 a.u. (A2). Tissue samples were obtained from each area and histological examinations including immunostaining of Ki-67 were performed. (b) Attenuation curves of Ki-67 SI ratios at A1 and A2 compared to A0 in the group with fluorescence intensity <1000 a.u. at final tumor resection (six patients, corresponding to LI-type GBM) (left graph) and in the group with intensity ≥1000 a.u. at final tumor resection (15 patients, corresponding to HI-type GBM) (right graph). In LI-type GBM, all six patients show A1/A0 ratios greater than or equal to the cutoff value of 0.55 and A2/A0 ratios less than the cutoff value of 0.04. In HI-type GBM, 14 patients present A2/A0 ratios ≥0.04, except one patient (Patient 15). This patient displays an A1/A0 ratio of 0.67, and so was classified with LI type tumour, the same as the invasive type evaluated on MRI. Although Patient 10 had been classified with LI-type tumor on MRI, both Ki-67 SI ratios of A1/A0 and A2/A0 showed values corresponding to HI-type tumor. (c) Bar graphs showing differences in Ki-67 SI ratio at A1 (A1/A0) (left) and at A2 (A2/A0) (right) between HI-type GBM and LI-type GBM. Values at A1 are significantly higher in LI-type GBM than in HI-type GBM (LI vs. HI: 0.717 ± 0.118 vs. 0.548 ± 0.168, p = 0.038). The cutoff of 0.55 offers 100% sensitivity and 60% specificity. Values at A2 are significantly higher in HI-type GBM than in LI-type GBM (HI vs. LI: 0.077 ± 0.04 vs. 0.03 ± 0.01, p = 0.0115), with a cutoff of 0.04 offering 100% sensitivity and 93.1% specificity. (d) Kaplan–Meier survival curves show PFS and OS in 21 patients with GBM types classified as HI (14 patients, weakly high-invasive (HIw): 6, moderately high-invasive (HIm): 5, strongly high-invasive (HIs): (3) and LI (7 patients), for which invasive types were determined by spectroscopic analysis of 5-ALA fluorescence). Both PFS and OS were significantly longer in patients with an LI-type GBM than in those with HI-type GBM (median PFS: LI vs. HIw, HIm, and HIs: 15.7 months vs. 5.9 months, 9.0 months, and 4.0 months, p = 0.0014; median OS: LI vs. HIw, HIm, and HIs: 26.5 months vs. 8.4 months, 17.0 months, and 8.3 months, respectively, p = 0.0068). * p < 0.05.
Figure 7
Figure 7
Relation between the degree of tumor invasiveness evaluated by 5-ALA fluorescence intensity and P/C ratio of CD44 expression. (a) Relationship between tumor invasiveness measured by 5-ALA fluorescence intensity and tumor density represented by Ki-67 SI ratio at A2 area (A2/A0). LI-type tumors showing fluorescence intensity <1000 a.u. present significantly lower Ki-67 SI ratio than all HI-type tumors showing fluorescence intensity ≥1000 a.u. (LI vs. HI: 0.031± 0.017 vs. 0.077± 0.04, p = 0.0115). Among HI-type tumors, HIs (>5000 a.u.) shows significantly higher Ki-67 SI ratio than HIw (1000–3000 a.u.) and HIm (3000–5000 a.u.), but HIw and HIm do not show any difference in Ki-67 SI (A2/A0) (HIs vs. HIw: 0.165 ± 0.05 vs. 0.067 ± 0.024, p = 0.00026, HIs vs. HIm: 0.165 ± 0.05 vs. 0.062 ± 0.017, p = 0.00014, HIw vs. HIm: 0.067 ± 0.024 vs. 0.062 ± 0.017, p = 0.975). (b) Relationship between CD44 expression (P/C ratio) and tumor invasiveness measured by 5-ALA fluorescence intensity. HI-type tumors with fluorescence intensity ≥1000 a.u. express significantly higher CD44 than LI-type tumors showing fluorescence intensity <1000 a.u. (HI vs. LI: 13.56 ± 10.59 vs. 1.19 ± 0.8, p = 0.0067). However, no significant difference is seen among HI-type tumor groups. (c) Spearman’s regression analysis shows a positive correlation between P/C ratio of CD44 expression and Ki-67 SI ratio at A2 (A2/A0). * p < 0.05, ** p < 0.01, *** p < 0.001, ns: not significant.

Similar articles

Cited by

References

    1. Stupp R., Mason W.P., van den Bent M.J., Weller M., Fisher B., Taphoorn M.J., Belanger K., Brandes A.A., Marosi C., Bogdahn U., et al. Radiotherapy plus concomitant and adjuvant temozolomide for glioblastoma. N. Engl. J. Med. 2005;352:987–996. doi: 10.1056/NEJMoa043330. - DOI - PubMed
    1. Stupp R., Hegi M.E., Mason W.P., van den Bent M.J., Taphoorn M.J., Janzer R.C., Ludwin S.K., Allgeier A., Fisher B., Belanger K., et al. Effects of radiotherapy with concomitant and adjuvant temozolomide versus radiotherapy alone on survival in glioblastoma in a randomised phase III study: 5-year analysis of the EORTC-NCIC trial. Lancet Oncol. 2009;10:459–466. doi: 10.1016/S1470-2045(09)70025-7. - DOI - PubMed
    1. Munthe S., Petterson S.A., Dahlrot R.H., Poulsen F.R., Hansen S., Kristensen B.W. Glioma cells in the tumor periphery have a stem cell phenotype. PLoS ONE. 2016;11:e0155106. - PMC - PubMed
    1. Angelucci C., D’Alessio A., Lama G., Binda E., Mangiola A., Vescovi A.L., Proietti G., Masuelli L., Bei R., Fazi B., et al. Cancer stem cells from peritumoral tissue of glioblastoma multiforme: The possible missing link between tumor development and progression. Oncotarget. 2018;9:28116–28130. doi: 10.18632/oncotarget.25565. - DOI - PMC - PubMed
    1. Inoue A., Ohnishi T., Kohno S., Ohue S., Nishikawa M., Suehiro S., Matsumoto S., Ozaki S., Fukushima M., Kurata M., et al. Met-PET uptake index for total tumor resection: Identification of 11C-methionine uptake index as a goal for total tumor resection including infiltrating tumor cells in glioblastoma. Neurosurg. Rev. 2021;44:587–597. doi: 10.1007/s10143-020-01258-7. - DOI - PubMed