. 2023 Aug 31;11(9):2434.
doi: 10.3390/biomedicines11092434.

Creation of an iPSC-Based Skeletal Muscle Model of McArdle Disease Harbouring the Mutation c.2392T>C (p.Trp798Arg) in the PYGM Gene

Affiliations

Creation of an iPSC-Based Skeletal Muscle Model of McArdle Disease Harbouring the Mutation c.2392T>C (p.Trp798Arg) in the PYGM Gene

Victoria Cerrada et al. Biomedicines. .

Abstract

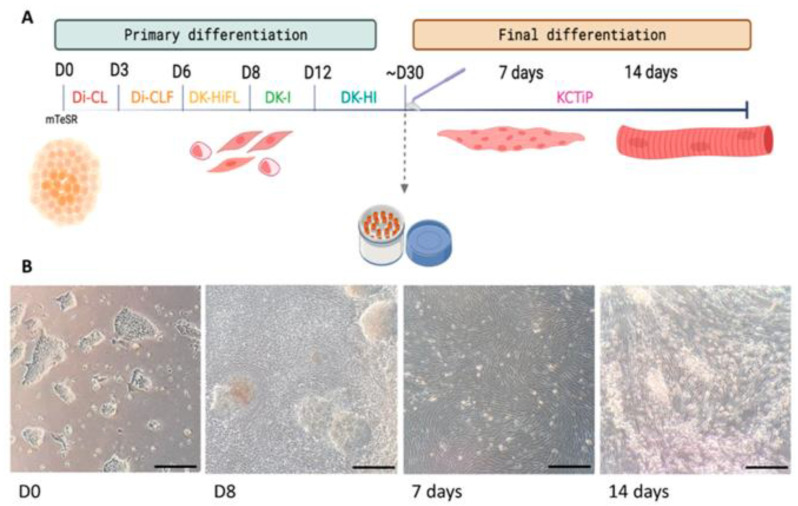
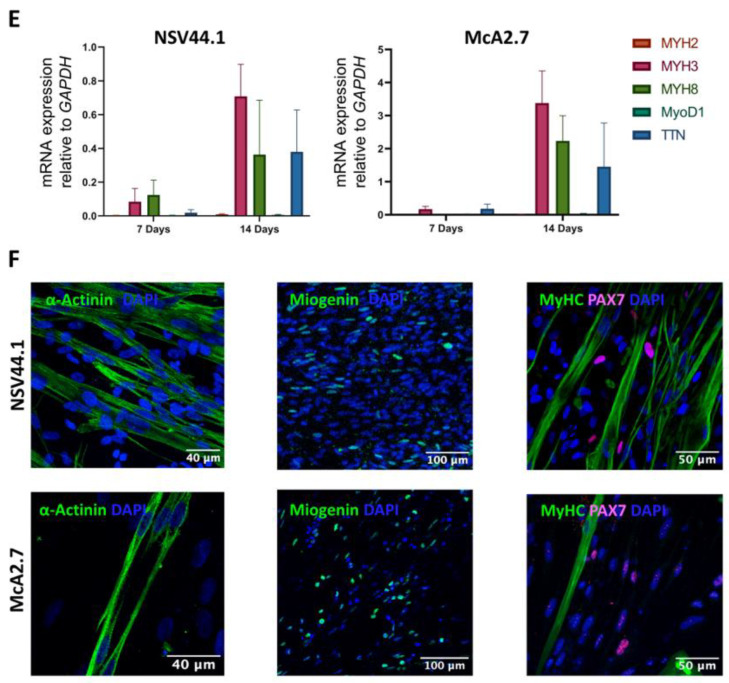
McArdle disease is a rare autosomal recessive condition caused by mutations in the PYGM gene. This gene encodes the skeletal muscle isoform of glycogen phosphorylase or myophosphorylase. Patients with McArdle disease have an inability to obtain energy from their muscle glycogen stores, which manifests as a marked exercise intolerance. Nowadays, there is no cure for this disorder and recommendations are intended to prevent and mitigate symptoms. There is great heterogeneity among the pathogenic variants found in the PYGM gene, and there is no obvious correlation between genotypes and phenotypes. Here, we present the generation of the first human iPSC-based skeletal muscle model harbouring the second most frequent mutation in PYGM in the Spanish population: NM_005609.4: c.2392T>C (p.Trp798Arg). To this end, iPSCs derived from a McArdle patient and a healthy control were both successfully differentiated into skeletal muscle cells using a small molecule-based protocol. The created McArdle skeletal muscle model was validated by confirming distinctive biochemical aspects of the disease such as the absence of myophosphorylase, the most typical biochemical feature of these patients. This model will be very valuable for use in future high-throughput pharmacological screenings.

Keywords: McArdle disease; PYGM; disease modelling; iPSCs; induced pluripotent stem cell; skeletal muscle differentiation.


Conflict of interest statement

The authors declare no conflict of interest.

Figures

Figure 1
Figure 1
Differentiation of iPSCs towards skeletal muscle. (A) Schematic representation of the skeletal muscle differentiation protocol. This process consists of two steps: a primary differentiation, lasting approximately 30 days, and a final differentiation, which takes 7 to 14 days. (B) Representative images of cultures taken during the differentiation process at days 0 and 8 of primary differentiation and at 7 and 14 days of final differentiation where the change in morphology of the cells can be noticed. Scale bars: 1 mm.
Figure 2
Figure 2
Characterization analyses of the differentiation process from iPSCs to skeletal muscles. (A) RT-qPCR analysis used to assess the primary differentiation process. The PAX3, PAX7, MYOD1, MYH3 and MYH8 genes were analysed at days 0, 8, 16 and 24 of the primary differentiation process. Values represent the mean of at least three independent replicates and are relative to the expression of the constitutive gene GAPDH. Error bars show the standard deviation. (B) Brightfield microscope image showing myogenic progenitors. Scale bar: 1 mm. (C) Immunofluorescence confocal microscopy analysis of myogenic progenitors. Some cells positive for the PAX7 marker are visible. Scale bar: 50 μm. (D) Diagram of the relative expression of PAX7 and PAX3 mRNA in myogenic progenitors. Values represent the mean of at least three independent replicates and are relative to the expression of the constitutive gene GAPDH. Error bars show the standard deviation. (E) RT-qPCR analysis used to assess the final differentiation process. The MYH2, MYH3, MYH8, MYOD1 and TTN genes were analysed at days 7 and 14 of the final differentiation process. Values represent the mean of at least three independent replicates and are relative to the expression of the constitutive gene GAPDH. Error bars show the standard deviation. (F) Immunocytochemical analyses of muscle fibres obtained by the differentiation of iPSC lines NSV44.1 and McA2.7. The fibres obtained show positive labelling for the markers α-actinin (F, left), miogenin (F, centre), MyHC and PAX7 (F, right). Scale bars: 40, 100 and 50 μm.
Figure 2
Figure 2
Characterization analyses of the differentiation process from iPSCs to skeletal muscles. (A) RT-qPCR analysis used to assess the primary differentiation process. The PAX3, PAX7, MYOD1, MYH3 and MYH8 genes were analysed at days 0, 8, 16 and 24 of the primary differentiation process. Values represent the mean of at least three independent replicates and are relative to the expression of the constitutive gene GAPDH. Error bars show the standard deviation. (B) Brightfield microscope image showing myogenic progenitors. Scale bar: 1 mm. (C) Immunofluorescence confocal microscopy analysis of myogenic progenitors. Some cells positive for the PAX7 marker are visible. Scale bar: 50 μm. (D) Diagram of the relative expression of PAX7 and PAX3 mRNA in myogenic progenitors. Values represent the mean of at least three independent replicates and are relative to the expression of the constitutive gene GAPDH. Error bars show the standard deviation. (E) RT-qPCR analysis used to assess the final differentiation process. The MYH2, MYH3, MYH8, MYOD1 and TTN genes were analysed at days 7 and 14 of the final differentiation process. Values represent the mean of at least three independent replicates and are relative to the expression of the constitutive gene GAPDH. Error bars show the standard deviation. (F) Immunocytochemical analyses of muscle fibres obtained by the differentiation of iPSC lines NSV44.1 and McA2.7. The fibres obtained show positive labelling for the markers α-actinin (F, left), miogenin (F, centre), MyHC and PAX7 (F, right). Scale bars: 40, 100 and 50 μm.
Figure 3
Figure 3
Immunofluorescence analyses to assess typical maturation markers of the myofibres generated by the directed differentiation of the NSV44.1 and McA2.7 iPSC lines. (A) Immunofluorescence images of muscle fibres with the MyHC marker highlighting the typical alignment of the obtained myofibres in the differentiation process corroborated with the directionality histograms obtained with the FiJi software (Wayne Rasband NIH, USA). Scale bar: 45 μm. (B) Representative immunocytochemical images of the sarcomere structure using α-actinin and troponin-T markers (TnT). Scale bar: 35 μm.
Figure 4
Figure 4
Validation of the McArdle disease skeletal muscle model. (A) TaqManTM assay to assess PYGM expression in skeletal muscle fibres differentiated from iPSCs. Both lines show mRNA expression at 7 and 14 days of final differentiation. There are no significant differences according to the Mann–Whitney statistical analysis. Values represent the mean of at least three independent replicates and are relative to the expression of the constitutive gene GAPDH. Error bars show the standard deviation. (B) Myophosphorylase protein immunodetection assay; α-tubulin was used as the loading control. Analyses demonstrate the presence of PYGM only in the skeletal muscle derived from the NSV44.1 control iPSC line. (C,D) Representative images of PAS staining of muscle fibres without (C) and with (D) a previous permeabilization stage (scale bar: 20 μm). The presence of purple clusters around the cell nuclei of McA2.7 fibres is highlighted. A 63× objective. (E) Confocal microscopy images showing positive labelling for the myophosphorylase marker PYGM in the NSV44.1 control fibres, indicated by yellow arrows. Scale bar: 100 μm.

Similar articles

Cited by

References

    1. Özen H. Glycogen storage diseases: New perspectives. World J. Gastroenterol. 2007;13:2541–2553. doi: 10.3748/wjg.v13.i18.2541. - DOI - PMC - PubMed
    1. Santalla A., Nogales-Gadea G., Ørtenblad N., Brull A., de Luna N., Pinós T., Lucia A. McArdle Disease: A Unique Study Model in Sports Medicine. Sport. Med. 2014;44:1531–1544. doi: 10.1007/s40279-014-0223-5. - DOI - PubMed
    1. Nogales-Gadea G., Brull A., Santalla A., Andreu A.L., Arenas J., Martín M.A., Lucia A., de Luna N., Pinós T. McArdle Disease: Update of Reported Mutations and Polymorphisms in the PYGM Gene. Hum. Mutat. 2015;36:669–678. doi: 10.1002/humu.22806. - DOI - PubMed
    1. Santalla A., Nogales-Gadea G., Encinar A.B., Vieitez I., González-Quintana A., Serrano-Lorenzo P., Consuegra I.G., Asensio S., Ballester-Lopez A., Pintos-Morell G., et al. Genotypic and phenotypic features of all Spanish patients with McArdle disease: A 2016 update. BMC Genom. 2017;18:819. doi: 10.1186/s12864-017-4188-2. - DOI - PMC - PubMed
    1. Quinlivan R., Martinuzzi A., Schoser B. Pharmacological and nutritional treatment for McArdle disease (Glycogen Storage Disease type V) Cochrane Database Syst. Rev. 2014;2014:CD003458. doi: 10.1002/14651858.CD003458.pub5. - DOI - PMC - PubMed

LinkOut - more resources