. 2023 Sep 4;11(9):2454.
doi: 10.3390/biomedicines11092454.

Identifying Aging-Related Biomarkers and Immune Infiltration Features in Diabetic Nephropathy Using Integrative Bioinformatics Approaches and Machine-Learning Strategies

Affiliations

Identifying Aging-Related Biomarkers and Immune Infiltration Features in Diabetic Nephropathy Using Integrative Bioinformatics Approaches and Machine-Learning Strategies

Tao Liu et al. Biomedicines. .

Abstract

Background: Aging plays an essential role in the development of diabetic nephropathy (DN). This study aimed to identify and verify potential aging-related genes associated with DN using bioinformatics analysis.

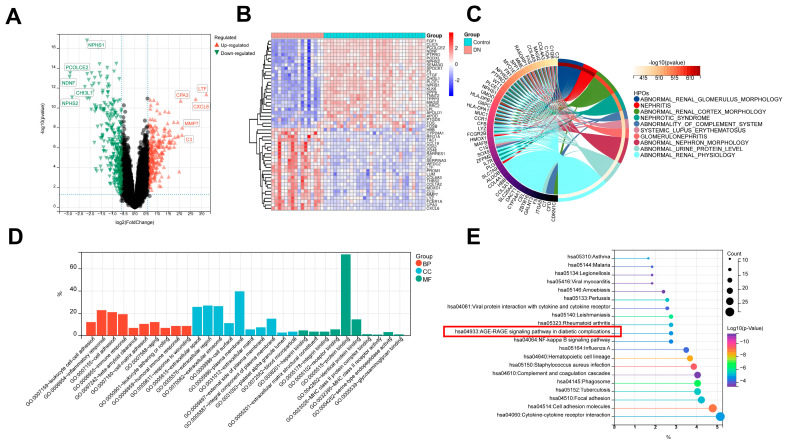
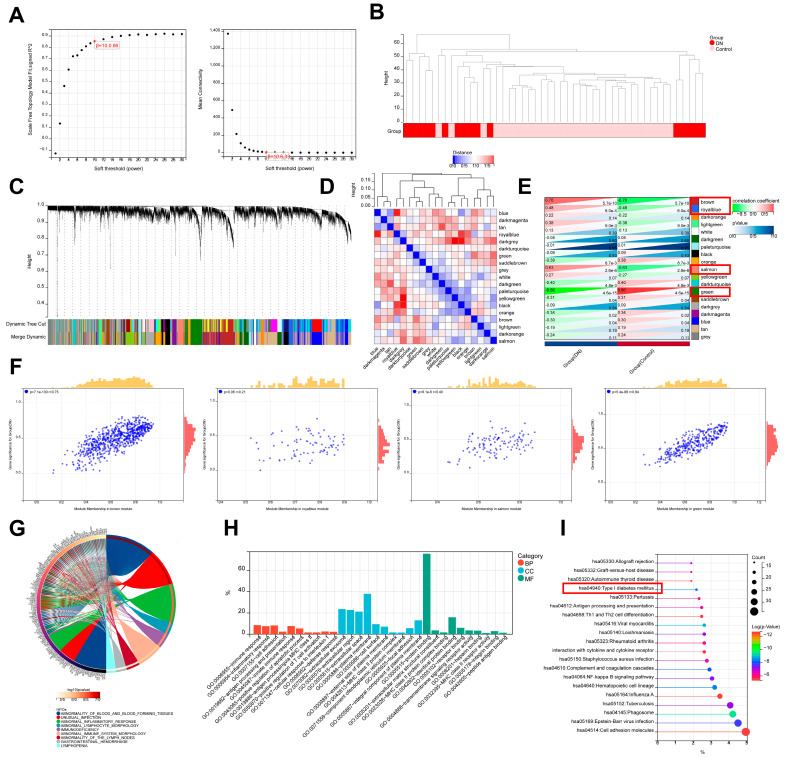
Methods: To begin with, we combined the datasets from GEO microarrays (GSE104954 and GSE30528) to find the genes that were differentially expressed (DEGs) across samples from DN and healthy patient populations. By overlapping DEGs, weighted co-expression network analysis (WGCNA), and 1357 aging-related genes (ARGs), differentially expressed ARGs (DEARGs) were discovered. We next performed functional analysis to determine DEARGs' possible roles. Moreover, protein-protein interactions were examined using STRING. The hub DEARGs were identified using the CytoHubba, MCODE, and LASSO algorithms. We next used two validation datasets and Receiver Operating Characteristic (ROC) curves to determine the diagnostic significance of the hub DEARGs. RT-qPCR, meanwhile, was used to confirm the hub DEARGs' expression levels in vitro. In addition, we investigated the relationships between immune cells and hub DEARGs. Next, Gene Set Enrichment Analysis (GSEA) was used to identify each biomarker's biological role. The hub DEARGs' subcellular location and cell subpopulations were both identified and predicted using the HPA and COMPARTMENTS databases, respectively. Finally, drug-protein interactions were predicted and validated using STITCH and AutoDock Vina.

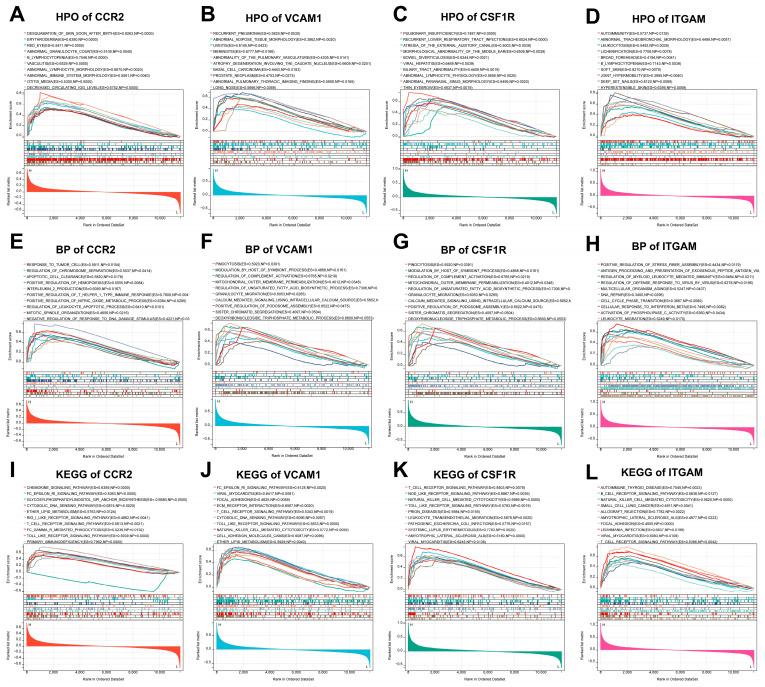
Results: A total of 57 DEARGs were identified, and functional analysis reveals that they play a major role in inflammatory processes and immunomodulation in DN. In particular, aging and the AGE-RAGE signaling pathway in diabetic complications are significantly enriched. Four hub DEARGs (CCR2, VCAM1, CSF1R, and ITGAM) were further screened using the interaction network, CytoHubba, MCODE, and LASSO algorithms. The results above were further supported by validation sets, ROC curves, and RT-qPCR. According to an evaluation of immune infiltration, DN had significantly more resting mast cells and delta gamma T cells but fewer regulatory T cells and active mast cells. Four DEARGs have statistical correlations with them as well. Further investigation revealed that four DEARGs were implicated in immune cell abnormalities and regulated a wide range of immunological and inflammatory responses. Furthermore, the drug-protein interactions included four possible therapeutic medicines that target four DEARGs, and molecular docking could make this association practical.

Conclusions: This study identified four DEARGs (CCR2, VCAM1, CSF1R, and ITGAM) associated with DN, which might play a key role in the development of DN and could be potential biomarkers in DN.

Keywords: aging; diabetic nephropathy; diagnostic biomarker; immune cell infiltration; molecular docking.


Conflict of interest statement

We declare that we do not have any commercial or associative interest that represents a conflict of interest in connection with the work submitted.

Figures

Figure 1
Figure 1
The study flowchart for DN based on integrative bioinformatics approaches and machine-learning strategies.
Figure 2
Figure 2
Data preprocessing. (A,B) Box diagram shows the dataset sample distributions before and after batch removal. (C,D) UMAP shows the dataset sample distributions before and after batch removal. (E,F) Density map shows the dataset sample distributions before and after batch removal.
Figure 3
Figure 3
Identification and function enrichment of DEGs for DN. (A,B) Volcano plot and cluster heatmap show DEGs between the DN and control group. (C) Human phenotype ontology analysis for DEGs. (D) GO biological processes analysis for DEGs. (E) KEGG pathway analysis for DEGs.
Figure 4
Figure 4
Identification of DN-associated key modules based on WGCNA analysis. (A) Scale-free fitting index analysis and mean connectivity of soft threshold power from 1 to 30. (B) Clustering dendrogram with tree leaves corresponding to individual samples. (C) Clustering dendrogram of all expressed genes based on a dissimilarity measure (1-TOM). (D) Correlation heatmap of the module feature vector. (E) Correlation heatmap between module eigengene and DN clinical trait. (F) Correlation scatter plot between DN gene significance and green module membership. (G) Human phenotype ontology analysis for green module genes. (H) GO biological processes analysis for green module genes. (I) KEGG pathway analysis for green module genes.
Figure 5
Figure 5
Identification and function enrichment of DEARGs for DN. (A) Identification of DEARGs with a Venn diagram. (B) Heat map showing differences in DEARGs between the DN and control group. (C) Human phenotype ontology analysis for DEARGs. (D) GO biological processes analysis for DEARGs. (E) KEGG pathway analysis for DEARGs.
Figure 6
Figure 6
Identification of hub DEARGs of DN. (A) PPI network of DEARGs. (B) Venn diagram showing the intersections of the DEARGs by cytoHubba and MCODE. (C,D) Four feature genes with non-zero coefficients were selected by optimal lambda based on the LASSO regression model. (E) GeneMANIA database showing DEARGs and their co-expression gene networks.
Figure 7
Figure 7
RT-qPCR and datasets validation, and diagnostic value of hub DEARGs for DN. (A) RT-qPCR validation of hub DEARGs. (B) Dataset validation of hub DEARGs by GSE104948. (C) Dataset validation of hub DEARGs by GSE30529. (D) ROC curves estimate the diagnostic values of DEARGs in merged datasets. (E) ROC curves estimate the diagnostic values of DEARGs in GSE104948. (F) ROC curves estimate the diagnostic values of DEARGs in GSE30529. (Note: **** p < 0.0001).
Figure 8
Figure 8
Immune infiltration analysis of DN. (A) Each sample’s proportion of different immune cells. (B) Correlation between different immune cells. (C) Expression abundance of different immune cells in DN and control. (Note: * p < 0.05, ** p < 0.01, *** p < 0.001 and **** p < 0.0001).
Figure 9
Figure 9
Correlation between the hub DEARGs and different immune cells. (A) CCR2; (B) VCAM1; (C) CSF1R; (D) ITGAM.
Figure 10
Figure 10
GSEA of hub DEARGs. (AD) Human phenotype ontology analysis for (A) CCR2, (B) VCAM1, (C) CSF1R, and (D) ITGAM. (EH) GO biological processes analysis for (E) CCR2, (F) VCAM1, (G) CSF1R, and (H) ITGAM. (IL) KEGG pathway analysis for (I) CCR2, (J) VCAM1, (K) CSF1R, and (L) ITGAM.
Figure 11
Figure 11
Single-cell expression analysis and subcellular localization of hub DEARGs. (AD) Single-cell expression analysis for (A) CCR2, (B) VCAM1, (C) CSF1R, and (D) ITGAM. (EH) Subcellular localization of (E) CCR2, (F) VCAM1, (G) CSF1R, and (H) ITGAM.
Figure 12
Figure 12
Drug–protein interactions based on molecular docking. (A) Molecular docking of CCR2 and cenicriviroc. (B) Molecular docking of VCAM1 and carvedilol. (C) Molecular docking of CSF1R and sunitinib. (D) Molecular docking of ITGAM and atorvastatin.

References

    1. Alicic R.Z., Rooney M.T., Tuttle K.R. Diabetic Kidney Disease: Challenges, Progress, and Possibilities. Clin. J. Am. Soc. Nephrol. 2017;12:2032–2045. doi: 10.2215/CJN.11491116. - DOI - PMC - PubMed
    1. Wada J., Makino H. Inflammation and the pathogenesis of diabetic nephropathy. Clin. Sci. 2013;124:139–152. doi: 10.1042/CS20120198. - DOI - PubMed
    1. Papadopoulou-Marketou N., Kanaka-Gantenbein C., Marketos N., Chrousos G.P., Papassotiriou I. Biomarkers of diabetic nephropathy: A 2017 update. Crit. Rev. Clin. Lab. Sci. 2017;54:326–342. doi: 10.1080/10408363.2017.1377682. - DOI - PubMed
    1. Oh S.W., Kim S., Na K.Y., Chae D.-W., Kim S., Jin D.C., Chin H.J. Clinical implications of pathologic diagnosis and classification for diabetic nephropathy. Diabetes Res. Clin. Pract. 2012;97:418–424. doi: 10.1016/j.diabres.2012.03.016. - DOI - PubMed
    1. Quan K.Y., Yap C.G., Jahan N.K., Pillai N. Review of early circulating biomolecules associated with diabetes nephropathy—Ideal candidates for early biomarker array test for DN. Diabetes Res. Clin. Pract. 2021;182:109122. doi: 10.1016/j.diabres.2021.109122. - DOI - PubMed