. 2023 Sep 17;11(9):2552.
doi: 10.3390/biomedicines11092552.

VprBP/DCAF1 Triggers Melanomagenic Gene Silencing through Histone H2A Phosphorylation

Affiliations

VprBP/DCAF1 Triggers Melanomagenic Gene Silencing through Histone H2A Phosphorylation

Yonghwan Shin et al. Biomedicines. .

Abstract

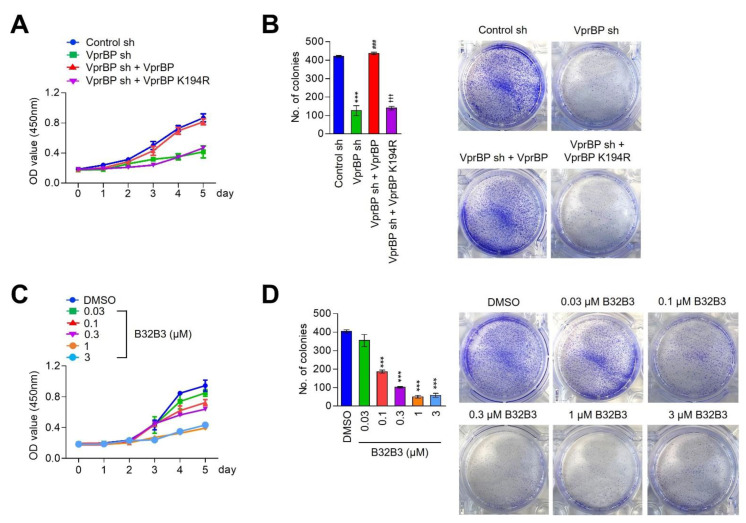
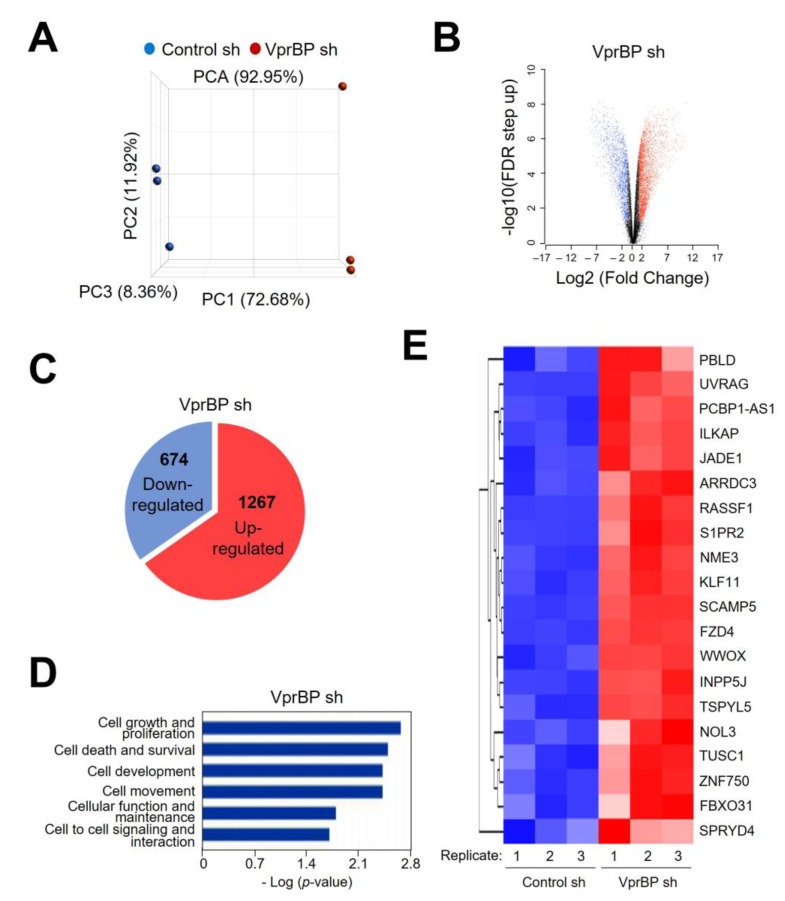
Vpr binding protein (VprBP), also known as DDB1- and CUL4-associated factor1 (DCAF1), is a recently identified atypical kinase and plays an important role in downregulating the transcription of tumor suppressor genes as well as increasing the risk for colon and prostate cancers. Melanoma is the most aggressive form of skin cancer arising from pigment-producing melanocytes and is often associated with the dysregulation of epigenetic factors targeting histones. Here, we demonstrate that VprBP is highly expressed and phosphorylates threonine 120 (T120) on histone H2A to drive the transcriptional inactivation of growth-regulatory genes in melanoma cells. As is the case for its epigenetic function in other types of cancers, VprBP acts to induce a gene silencing program dependent on H2AT120 phosphorylation (H2AT120p). The significance of VprBP-mediated H2AT120p is further underscored by the fact that VprBP knockdown- or VprBP inhibitor-induced lockage of H2AT120p mitigates melanoma tumor growth in xenograft models. Collectively, our results establish VprBP-mediated H2AT120p as a key epigenetic signal for melanomagenesis and suggest the therapeutic potential of targeting VprBP kinase activity for effective melanoma treatment.

Keywords: H2A; VprBP; histone; kinase; melanoma; phosphorylation.


Conflict of interest statement

The authors declare no competing interests.

Figures

Figure 1
Figure 1
VprBP is overexpressed and mediates H2AT120p in melanoma cells. (A) Whole cell lysates and chromatin fractions were prepared from melanoma (G361, MeWo, SK-MEL-5, and A375) and melanocyte (NHEM2) cells and analyzed by Western blotting with VprBP, H2AT120p, and H2A antibodies. Actin served as a control for equal protein loading. A representative blot of three independent experiments is displayed. (B) G361 cells were transfected with nontargeting control (control) or VprBP shRNA, and whole cell lysates and chromatin fractions were analyzed by Western blotting with the indicated antibodies. VprBP-depleted cells were also complemented by shRNA-resistant VprBP wild-type or kinase-dead mutant K194R to check their rescue effects. Actin was used as a loading control. (C) VprBP-depleted G361 cells were transfected with VprBP wild-type or K194R and immunostained with H2AT120p antibody. Representative images of three independent experiments are shown. Bar, 10 µM. (D) Human normal skin and melanoma tissues were subjected to immunohistochemistry with antibodies against VprBP and H2AT120p. High power magnifications are shown for representative immunostaining samples. Bar, 50 µm. (E) G361 cells were grown in the presence of the indicated concentrations of VprBP inhibitor B32B3 for 72 h. Western blot analysis of cell lysates and chromatin prepared from the G361 cells with VprBP, H2AT120p, H2A, and Actin antibodies. Shown are the representative results of three independent experiments. (F) G361 cells were immunostained with H2AT120p antibody to monitor relative changes in H2AT120p levels after treating with B32B3 as in (E). Images are representative of three independent experiments.
Figure 2
Figure 2
VprBP downregulation restricts melanomagenesis. (A) VprBP-depleted G361 cells were complemented with VprBP wild-type or kinase-dead mutant, and their proliferation was assessed after 5 days of culture by MTT assay. Results represent the mean ± SD of three experiments performed in triplicate. (B) The indicated G361 cells were allowed to form colonies for 2 weeks in 6-well plates, stained with Crystal violet, and counted. Data represent the mean ± SD of three independent experiments in triplicate well; p values were calculated using paired t-tests. *** p < 0.001 versus control sh; ### p < 0.001 versus VprBP sh; and ††† p < 0.001 versus control sh. (C) G361 cells were treated with VprBP inhibitor B32B3 for 5 days, and their viability was measured by MTT assay. Data represent the mean ± SD of three independent experiments performed in triplicate. (D) Colony formation assays were conducted as in B, but after treating with VprBP inhibitor B32B3 for 5 days. Data are representative of three independent experiments performed in triplicate and represent the mean ± SD; p values were calculated using paired t-tests. *** p < 0.001 versus DMSO.
Figure 3
Figure 3
VprBP impairs the expression of growth-controlling genes. (A) Principal component analysis (PCA) results of RNA-seq datasets generated in G361 melanoma cells. VprBP knockdown (VprBP sh) group is shown in red, and control (control sh) group is shown in blue. Three replicates were generated per group. (B) A volcano plot of RNA-seq datasets is shown. −log10 (FDR step up) is shown on the Y-axis, and fold change in gene expression between VprBP knockdown and control groups is shown on the X-axis. Genes modulated after VprBP depletion are colored in blue (downregulated) and red (upregulated). (C) Venn diagram showing genes that are upregulated or downregulated (>2 fold; FDR < 0.05) in VprBP-depleted G361 cells compared to mock-depleted control cells. (D) Gene ontology analysis of the activated genes after knockdown of VprBP using Ingenuity Pathway Analysis (IPA version 52912811) tool developed by Qiagen. (E) Heatmap of 20 genes most activated upon VprBP depletion. Normalized gene expression levels (Z-scores) are plotted. High and low expression are shown in red and blue, respectively.
Figure 4
Figure 4
VprBP target genes are enriched for H2AT120p. (A) RNA samples were prepared from mock-depleted control, VprBP-depleted, or wild-type/mutant VprBP-transfected VprBP-depleted G361 cells and analyzed by RT–qPCR using primers listed in Table S1. All transcription levels were normalized to that of GAPDH. Data are expressed as mean ± SD (N = 3); p values were calculated using paired t-tests. *** p < 0.001 versus control sh; ### p < 0.001 versus VprBP sh; and ††† p < 0.001 versus control sh. (B) ChIP assays were performed in control, VprBP-depleted, and VprBP-complemented VprBP-depleted G361 cells with VprBP, H2AT120p, and H2A antibodies as indicated. All ChIP DNAs were analyzed by real-time PCR with primer pairs amplifying the promoters, transcription start sites, and coding regions of the INPP5J (upper panel), ZNF750 (middle panel), and TUSC1 (lower panel) genes. Primers used are listed in Table S2. Error bars denote the mean ± SD obtained from triplicate real-time PCRs. All transcription levels were normalized to those of GAPDH. Data were expressed as mean ± SD (N = 3); *** p < 0.001 versus control sh; ### p < 0.001 versus VprBP sh; and ††† p < 0.001 versus control sh. (C) G361 cells were treated with VprBP inhibitor B32B3 for 72 h, and VprBP target gene expression was analyzed by RT-qPCR as in A. Data were expressed as mean ± SD (N = 3); p values were calculated using paired t-tests. *** p < 0.001 versus DMSO. (D) ChIP assays were performed as in B but using B32B3-treated G361 cells. Data were expressed as mean ± SD (N = 3); *** p < 0.001 versus DMSO.
Figure 5
Figure 5
dCas9-VprBP fusion specifically inactivates target gene transcription. (A) Schematic diagram of the CAG-based constructs driving the expression of dCas9 or dCas9—VprBP wt/K194R kinase dead mutant and sgRNAs targeting INPP5J, ZNF750, and TUSC1 genes. (B) VprBP-depleted G361 cells were transfected with the indicated dCas9 and sgRNA expression constructs for 48hr, and total RNA was isolated and analyzed by qRT-PCR using primers specific for the INPP5J, ZNF750, and TUSC1 genes. Data represent the mean ± S.D. (N = 3); *** p < 0.001 versus control. (C) VprBP-depleted G361 cells were transfected with dCas9 and sgRNA expression constructs as in (B), and the levels of H2AT120p at the promoter and coding regions of the INPP5J, ZNF750, and TUSC1 genes were assessed by ChIP-qPCR. Data represent the mean ± S.D. (N = 3); *** p < 0.001 versus control. (D) VprBP was guided to target genes by using CRISPR/dCas9 system as in C and changes in cell growth were assessed by MTT assays over a period of 5 days. The results represent the mean  ±  SD of three experiments performed in triplicate. (E) Colony formation assays were carried out with G361 cells after selectively downregulating INPP5J, ZNF750, and TUSC1 genes by CRISPR/dCas9 system as in B. Data represent the mean  ±  SD of three independent experiments in triplicate wells; *** p  <  0.001.
Figure 6
Figure 6
VprBP knockdown reduces melanoma tumor growth in vivo. (A) Mock-depleted control, VprBP-depleted, or wild-type/mutant VprBP-transfected VprBP-depleted G361 cells were injected into the right side of mouse skin. Mice were sacrificed 24 days after G361 cell injection, and melanoma xenografts were surgically excised and photographed (lower panel, scale—1 cm). (B) Melanoma xenograft tumor volume was measured every 3 days after injecting G361 cells into mice as in (A). (C) G361 melanoma xenografts were excised as in (A), and their weights were measured and expressed in milligrams. Data are presented as the mean ± S.D (N = 6); *** p < 0.001 versus control sh; ### p < 0.001 versus VprBP sh; and ††† p < 0.001 versus control sh. (D) Relative mRNA levels of INPP5J, ZNF750, and TUSC1 genes in G361 melanoma xenografts obtained 24 days post-injection were determined by RT-qPCR. Data represent the mean ± S.D. (N = 3); *** p < 0.001 versus control sh; ### p < 0.001 versus VprBP sh; and ††† p < 0.001 versus control sh. (E) The excised G361 xenografts were analyzed by Western blotting with the indicated antibodies.
Figure 7
Figure 7
VprBP inhibition reduces melanoma tumor growth in vivo. (A) Melanoma xenografts were established as in Figure 6 and treated with DMSO or VprBP inhibitor B32B3 for 24 days. Mice were sacrificed at the end of 24-day B32B3 treatment, and melanoma xenografts were surgically excised and photographed (lower panel, scale: 1 cm). (B) The volume of melanoma xenograft tumors was measured every 3 days over a 24-day B32B3 treatment period. (C) After treating with B32B3 for 24 days, G361 melanoma xenografts were excised from mice, and tumor weight was measured. Data represent the mean ± S.D. (N = 6); * p < 0.05, *** p < 0.001 versus DMSO. (D) After 24 days of B32B3 treatment, G361 melanoma xenografts were excised as in C and relative mRNA levels of INPP5J, ZNF750, and TUSC1 genes were measured by RT-qPCR. Data represent the mean ± S.D. (N = 3); *** p < 0.001 versus DMSO. (E) Western blot analysis of the excised melanoma xenografts using the antibodies indicated on the left.

Update of

Similar articles

Cited by

References

    1. Zhang S., Feng Y., Narayan O., Zhao L.J. Cytoplasmic retention of HIV-1 regulatory protein Vpr by protein-protein interaction with a novel human cytoplasmic protein VprBP. Gene. 2001;263:131–140. doi: 10.1016/S0378-1119(00)00583-7. - DOI - PubMed
    1. Huang J., Chen J. VprBP targets Merlin to the Roc1-Cul4A-DDB1 E3 ligase complex for degradation. Oncogene. 2008;27:4056–4064. doi: 10.1038/onc.2008.44. - DOI - PubMed
    1. Le Rouzic E., Belaidouni N., Estrabaud E., Morel M., Rain J.C., Transy C., Margottin-Goguet F. HIV1 Vpr arrests the cell cycle by recruiting DCAF1/VprBP, a receptor of the Cul4-DDB1 ubiquitin ligase. Cell Cycle. 2007;6:182–188. doi: 10.4161/cc.6.2.3732. - DOI - PubMed
    1. McCall C.M., de Marval P.L.M., Chastain P.D., 2nd, Jackson S.C., He Y.J., Kotake Y., Cook J.G., Xiong Y. Human immunodeficiency virus type 1 Vpr-binding protein VprBP, a WD40 protein associated with the DDB1-CUL4 E3 ubiquitin ligase, is essential for DNA replication and embryonic development. Mol. Cell. Biol. 2008;28:5621–5633. doi: 10.1128/MCB.00232-08. - DOI - PMC - PubMed
    1. Han X.R., Sasaki N., Jackson S.C., Wang P., Li Z., Smith M.D., Xie L., Chen X., Zhang Y., Marzluff W.F., et al. CRL4(DCAF1/VprBP) E3 ubiquitin ligase controls ribosome biogenesis, cell proliferation, and development. Sci. Adv. 2020;6:eabd6078. doi: 10.1126/sciadv.abd6078. - DOI - PMC - PubMed