. 2023 Sep 18;11(9):2566.
doi: 10.3390/biomedicines11092566.

Audiogenic Seizures and Social Deficits: No Aggravation Found in Krushinsky-Molodkina Rats

Affiliations

Audiogenic Seizures and Social Deficits: No Aggravation Found in Krushinsky-Molodkina Rats

Anastasiya Rebik et al. Biomedicines. .

Abstract

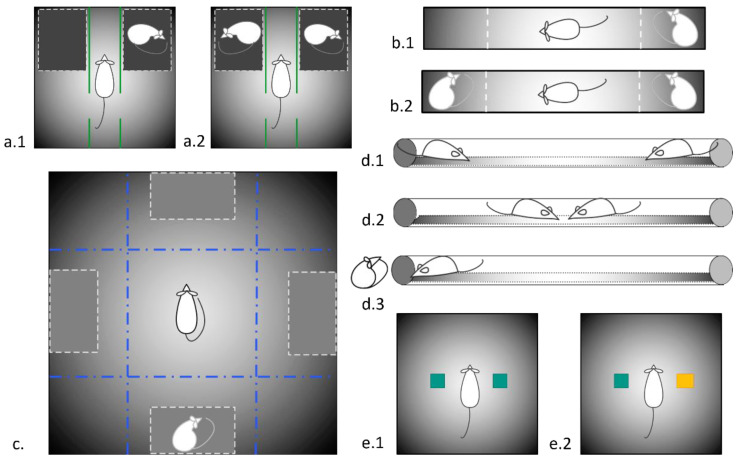
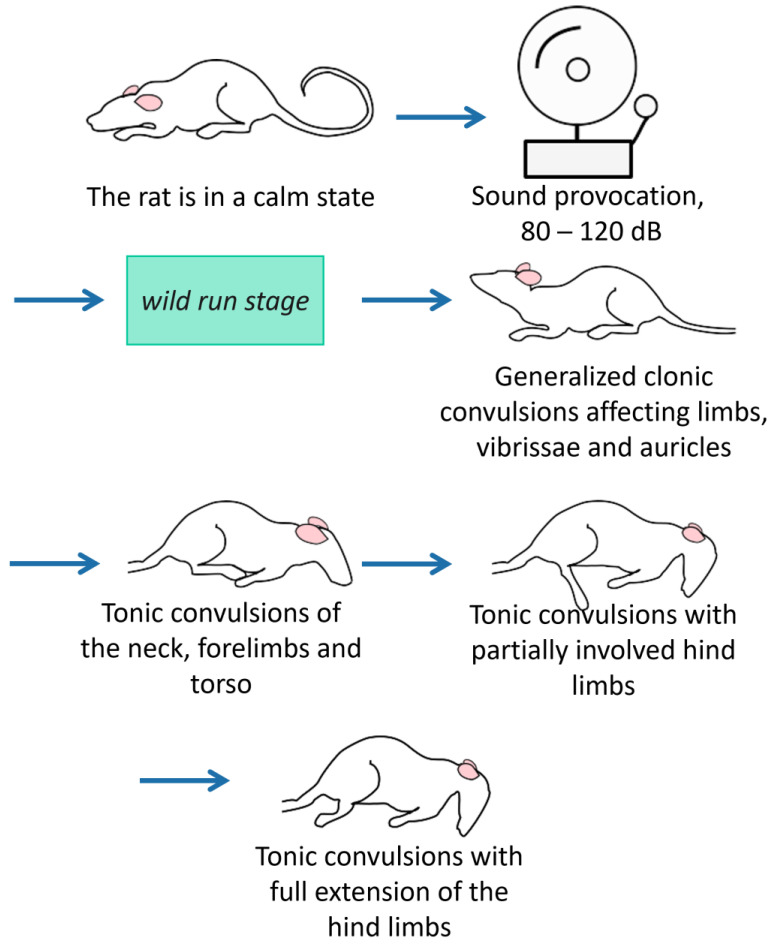
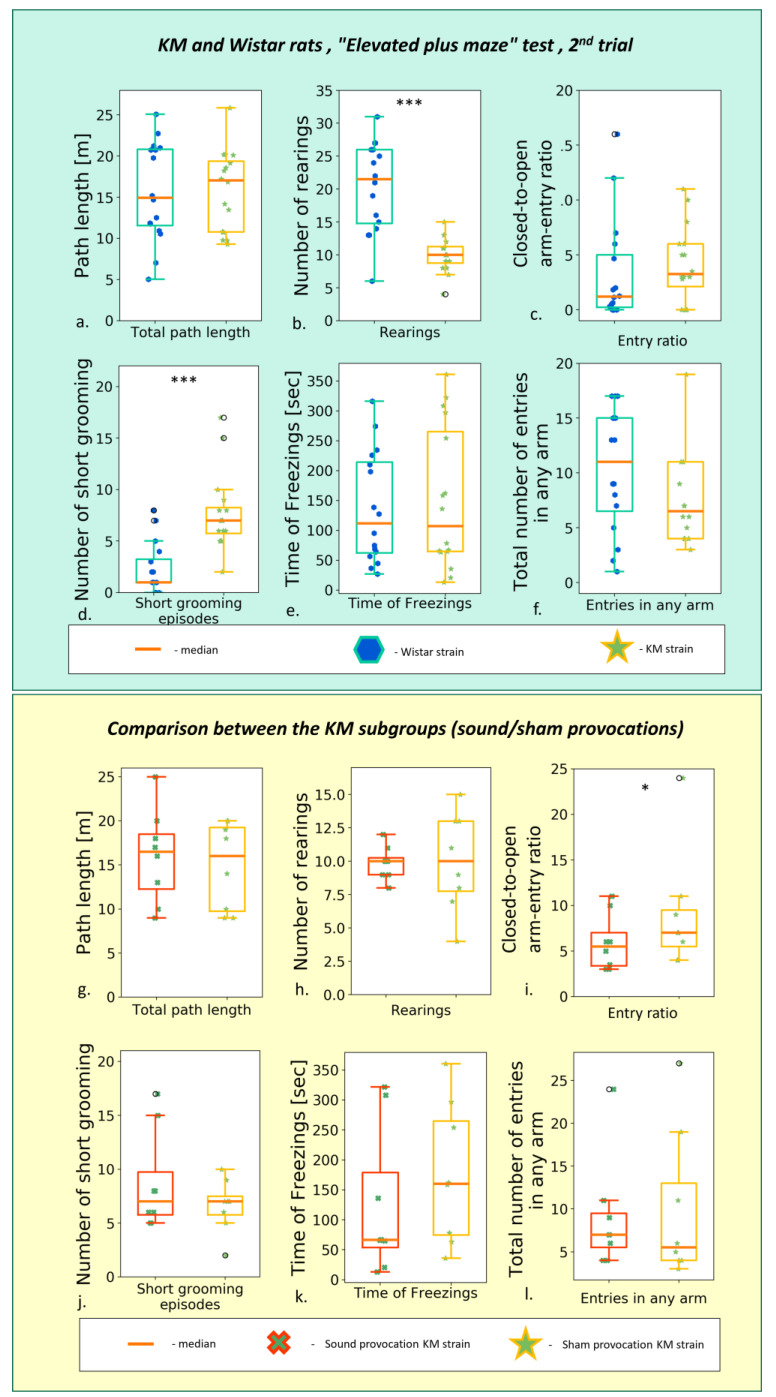
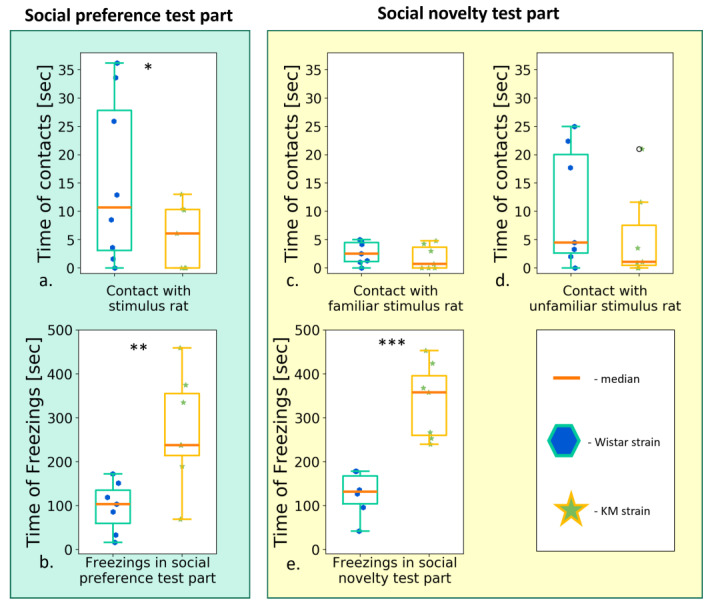
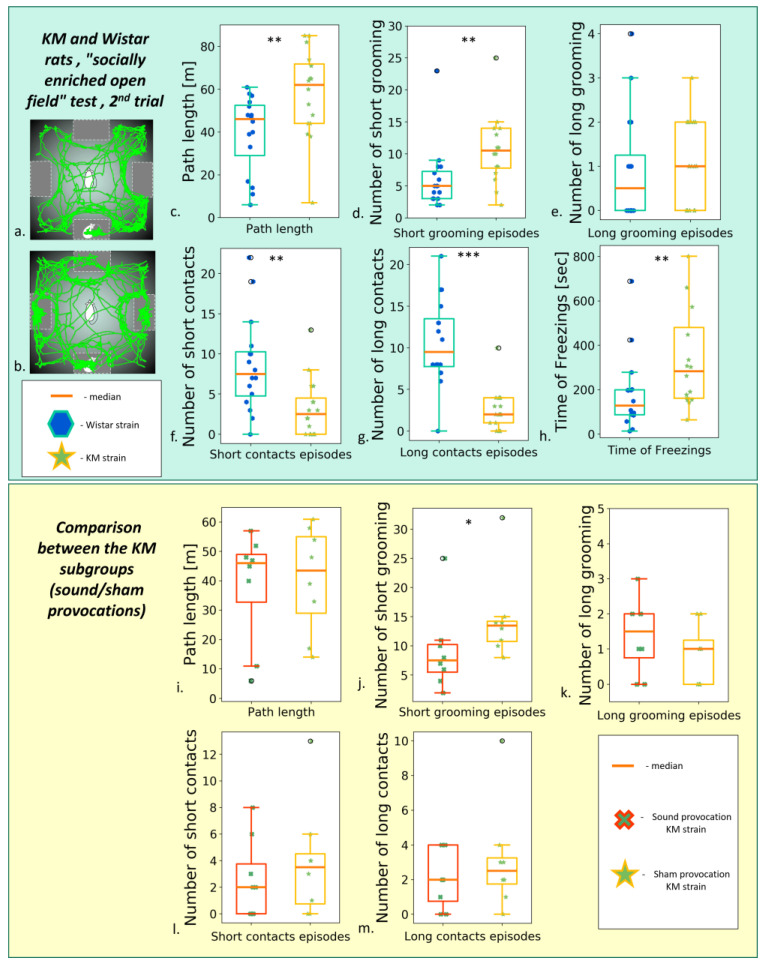
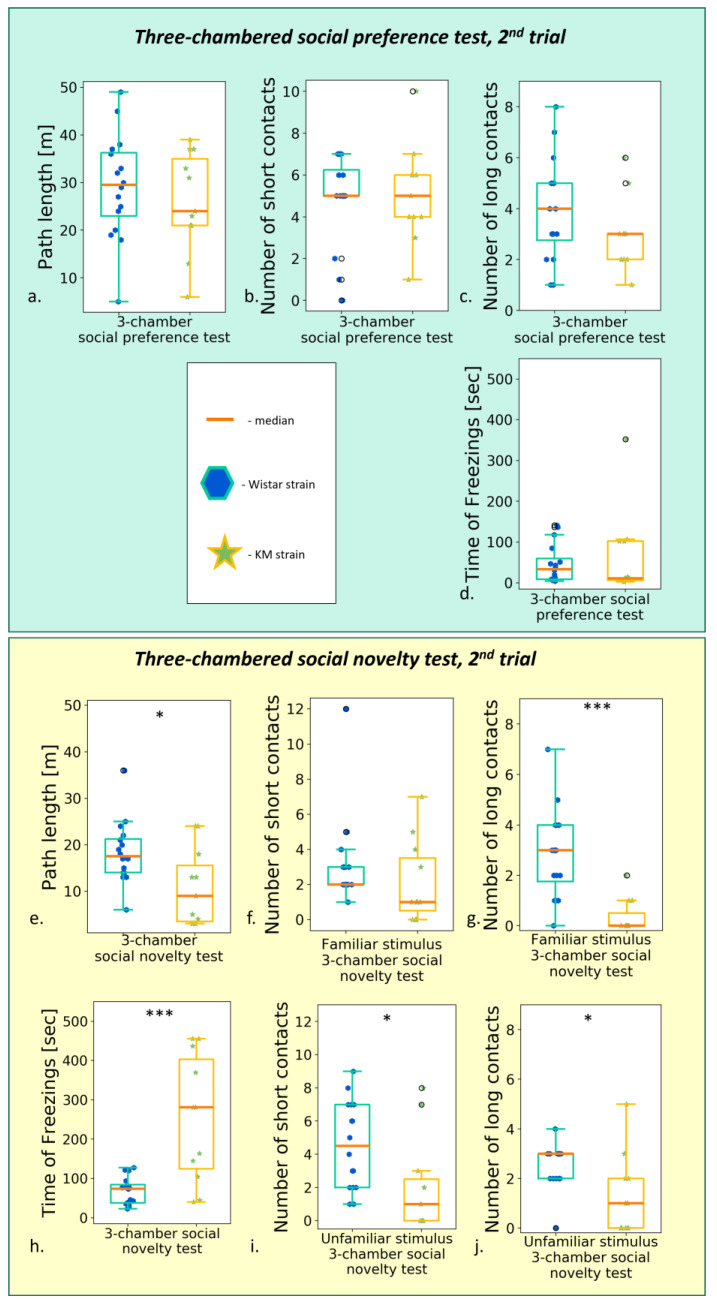
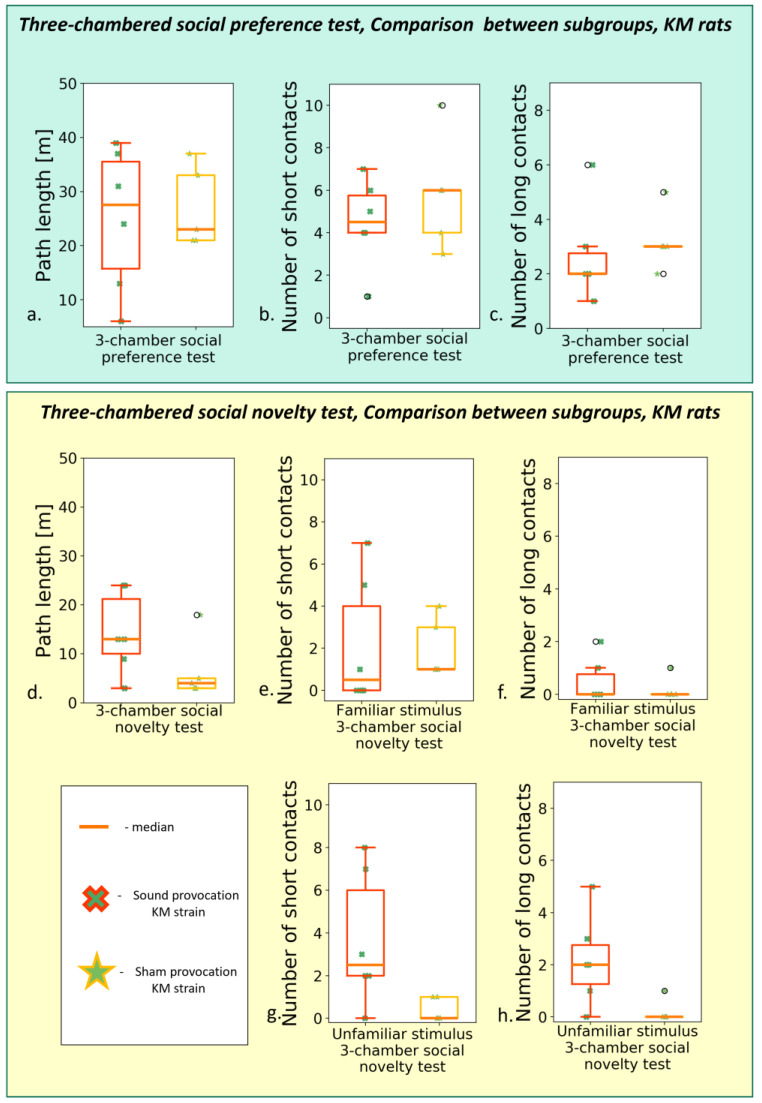
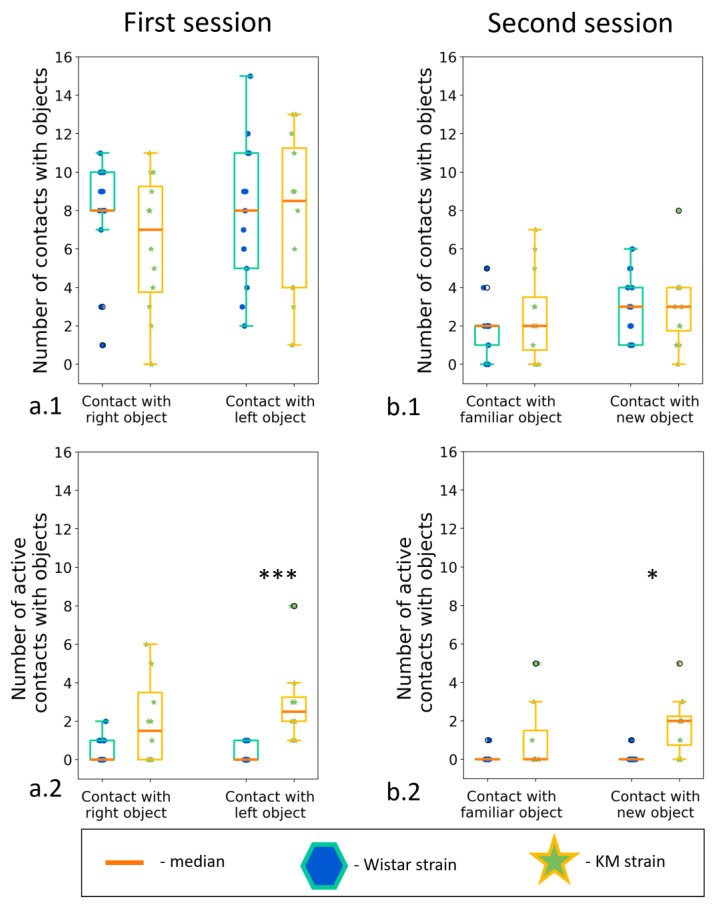
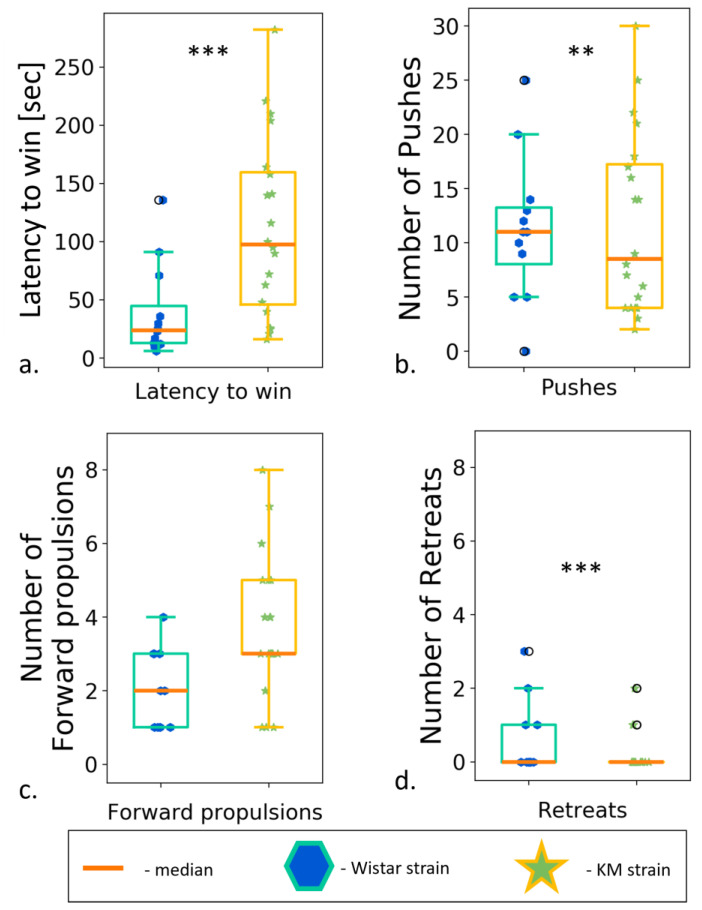
Epilepsy or epileptic syndromes affect more than 70 million people, often comorbid with autism spectrum disorders (ASD). Seizures are concerned as a factor for social regression in ASD. A stepwise experimental approach to this problem requires an animal model to provoke seizures and monitor subsequent behavior. We used rats of the Krushinsky-Molodkina (KM) strain as a validated inbred genetic model for human temporal lobe epilepsy, with recently described social deficiency and hypolocomotion. Generalized tonic-clonic seizures in KM rats are sound-triggered, thus being controlled events in drug-naïve animals. We studied whether seizure experience would aggravate contact deficits in these animals. Locomotor and contact parameters were registered in "the elevated plus maze", "socially enriched open field", and "social novelty/social preference tests" before and after sound-provoked seizures. The triple seizure provocations minimally affected the contact behavior. The lack of social drive in KM rats was not accompanied by a submissive phenotype, as tested in "the tube dominance test", but featured with a poor contact repertoire. Here, we confirmed our previous findings on social deficits in KM rats. The contact deficiency was dissociated from hypolocomotion and anxiety and did not correlate with seizure experience. It was established that experience of rare, generalized tonic-clonic convulsions did not lead to an impending regress in contact motivation, as seen in an animal model of genetic epilepsy and comorbid social deficiency. One of the oldest animal models for epilepsy has a translational potential to study mechanisms of social behavioral deficits in future neurophysiological and pharmacological research.

Keywords: KM rats; Wistar rats; animal models; anxiety; autism spectrum disorder; autistic disorder; epilepsy; motivation; phenotype; seizures.


Conflict of interest statement

The authors declare no conflict of interest.

Figures

Figure 1
Figure 1
Schemes of experimental set-ups used in the study. (a.1) Three-chambered social preference test; (a.2) Three-chambered social novelty test; (b.1) The two-choice test for social preference/social novelty, 1st session, social preference; (b.2) The two-choice test for social preference/social novelty, 2nd session, social novelty (c) Socially enriched open field; (d.1d.3) different stages of social dominance test; (e.1,e.2) 1st and 2nd session of two-object/novel object recognition test.
Figure 2
Figure 2
The stages of audiogenic fits in KM rats. The seizure fits start with motor excitation (wild running with a loss of visual control), quickly proceed to clonic convulsions on a side and on the belly, and end up with tonic phases (with the tonic limbs’ extension). These stages of audiogenic fits are: wild run, clonic seizures on a belly, tonic seizure. In total, 100% of the KM rats develop the maximal stage of audiogenic fits in response to the sound administration.
Figure 3
Figure 3
Behavior in the second (post-provocation) “elevated plus maze” test, comparison between the rat strains (upper panel, Wistar vs. KM) and KM subgroups (lower panel, sound provocation vs. sham provocation). Upper panel: (a) The total path travelled; (b) number of rearings t; (c) closed-to-open arm-entry ratio; (d) number of short (facial) grooming bouts; (e) total time of freezing behavior; (f) total number of entries in any arm. Lower panel: (g) The total path travelled; (h) number of rearings t; (i) closed-to-open arm-entry ratio; (j) number of short (facial) grooming bouts; (k) total time of freezing behavior; (l) total number of entries in any arm. Data are represented as the box plot and whiskers (indicating variability outside the upper and lower quartiles). Statistical significance is indicated as follows: *** p < 0.001, * p < 0.05.
Figure 4
Figure 4
Contact activity of Wistar (blue points) and KM (green stars), in the test of “two choice social preference test”. (a) Time of contact with an unfamiliar stimulus rat; (b) total freezing time of rats during the test; (c) time of contact with a familiar stimulus rat during the “social novelty” part; (d) time of contact with an unfamiliar stimulus rat during the “social novelty” part; (e) total freezing time during the “social novelty” session. Data are represented as the box plot and whiskers (indicating variability outside the upper and lower quartiles). Statistical significance is indicated as follows: *** p < 0.001, ** p < 0.01, * p < 0.05.
Figure 5
Figure 5
Behavior in the “socially enriched open field” test, the second test (post-provocation). (a) An example of Wistar rat trajectory; (b) an example of KM rat trajectory. Upper panel: comparisons between the strains. (c) The total path length; number of short (d) and long (e) grooming; the number of short (f) and long (g) of snout-to-box contacts of the freely moving experimental animals; (h) the total freezing time. Lower panel: comparison between seizure-experienced and seizure-naïve KM subgroups. (i) The total path length, comparison between the KM subgroups. Number of short (j) and long (k) grooming; number of short (l) and long (m) snout-to-box contact, comparison between the KMs subgroups. Data are represented as a box plot and whiskers (indicating variability outside the upper and lower quartiles). Statistical significance is indicated as follows: *** p < 0.001, ** p < 0.01, * p < 0.05.
Figure 6
Figure 6
Behavior in the “social preference/social novelty” tests, post-provocation, between groups comparison (Wistar vs. KM rats). The “social preference” session: (a) total path travelled; (b) number of short contacts; (c) number of long contacts; (d) total time of freezing s. The “social novelty” session: (e) total path travelled; (f) number of short contacts with “old” stimulus; (g) number of long contacts with “old” stimulus; (h) time of freezing response; (i) number of short contacts with “new” stimulus; (j) number of long contacts with “new” stimulus. Data are represented as a box plot and whiskers (indicating variability outside the upper and lower quartiles). Statistical significance is indicated as follows: *** p < 0.001, * p ≤ 0.05.
Figure 7
Figure 7
Behavior in the “social preference/social novelty” tests, post-provocation; comparison between the KM subgroups. The “social preference” session: (a) total path length; (b) number of short contacts; (c) number of long contacts. The “social novelty” session: (d) total path length, (e) number of short contacts with “familiar” stimulus; (f) number of long contacts with “familiar” stimulus; (g) number of short contacts with “unfamiliar” stimulus; (h) number of long contacts with “unfamiliar” stimulus. Data are represented as a box plot and whiskers (indicating variability outside the upper and lower quartiles). No significant difference was seen between the subgroups.
Figure 8
Figure 8
The “two objects novel object test”, between strain comparisons. Investigation of new and familiar objects. (a.1) Contacts with a new object; (a.2) active contacts with a new object; (b.1) contact with an “old” object; (b.2) Active contact with an “old” object. Data are represented as a box plot and whiskers (indicating variability outside the upper and lower quartiles). Statistical significance is indicated as follows: *** p < 0.001, * p < 0.05.
Figure 9
Figure 9
Social dominance test, between strain comparisons. (a) Latency to win; (b) number of pushes; (c) number of forward propulsions; (d) number of retreats. Data are represented as a box plot and whiskers (indicating variability outside the upper and lower quartiles). Statistical significance is indicated as follows: *** p < 0.001, ** p < 0.01.

Similar articles

Cited by

References

    1. Liu X., Sun X., Sun C., Zou M., Chen Y., Huang J., Wu L., Chen W.-X. Prevalence of Epilepsy in Autism Spectrum Disorders: A Systematic Review and Meta-Analysis. Autism. 2022;26:33–50. doi: 10.1177/13623613211045029. - DOI - PubMed
    1. Besag F. Epilepsy in Patients with Autism: Links, Risks and Treatment Challenges. Neuropsychiatr. Dis. Treat. 2017;14:1–10. doi: 10.2147/NDT.S120509. - DOI - PMC - PubMed
    1. Gadow K.D., Perlman G., Weber R.J. Parent-Reported Developmental Regression in Autism: Epilepsy, IQ, Schizophrenia Spectrum Symptoms, and Special Education. J. Autism Dev. Disord. 2017;47:918–926. doi: 10.1007/s10803-016-3004-1. - DOI - PubMed
    1. Zahra A., Wang Y., Wang Q., Wu J. Shared Etiology in Autism Spectrum Disorder and Epilepsy with Functional Disability. Behav. Neurol. 2022:1–13. doi: 10.1155/2022/5893519. - DOI - PMC - PubMed
    1. Brooks-Kayal A. Epilepsy and autism spectrum disorders: Are there common developmental mechanisms? Brain Dev. 2010;32:731–738. doi: 10.1016/j.braindev.2010.04.010. - DOI - PubMed

LinkOut - more resources