. 2023 Sep 5;24(18):13713.
doi: 10.3390/ijms241813713.

Euphorbiasteroid Induces Apoptosis as Well as Autophagy through Modulating SHP-1/STAT3 Pathway in Hepatocellular Carcinoma Cells

Affiliations

Euphorbiasteroid Induces Apoptosis as Well as Autophagy through Modulating SHP-1/STAT3 Pathway in Hepatocellular Carcinoma Cells

Na Young Kim et al. Int J Mol Sci. .

Abstract

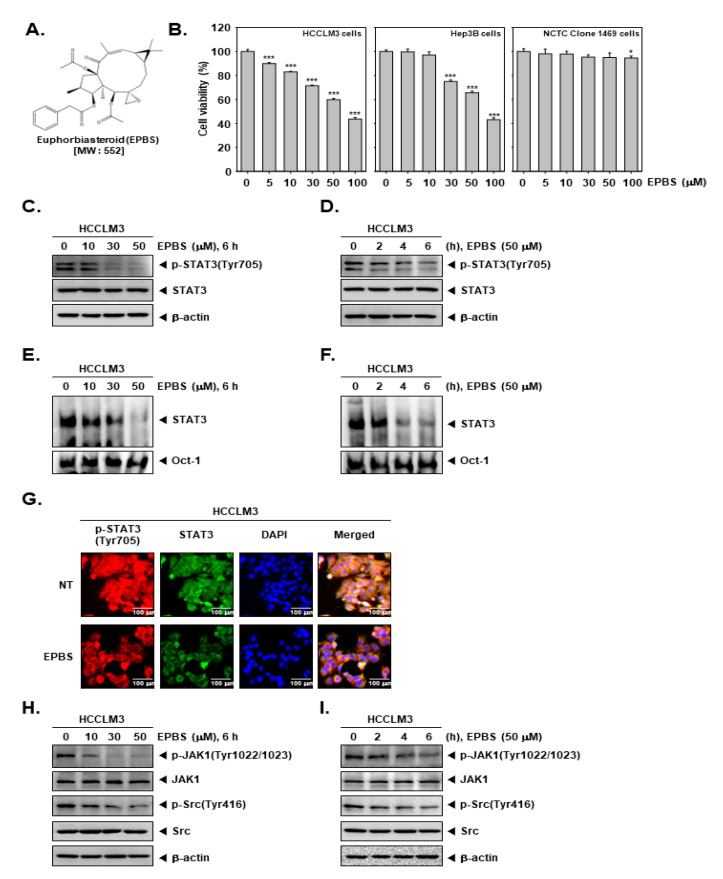
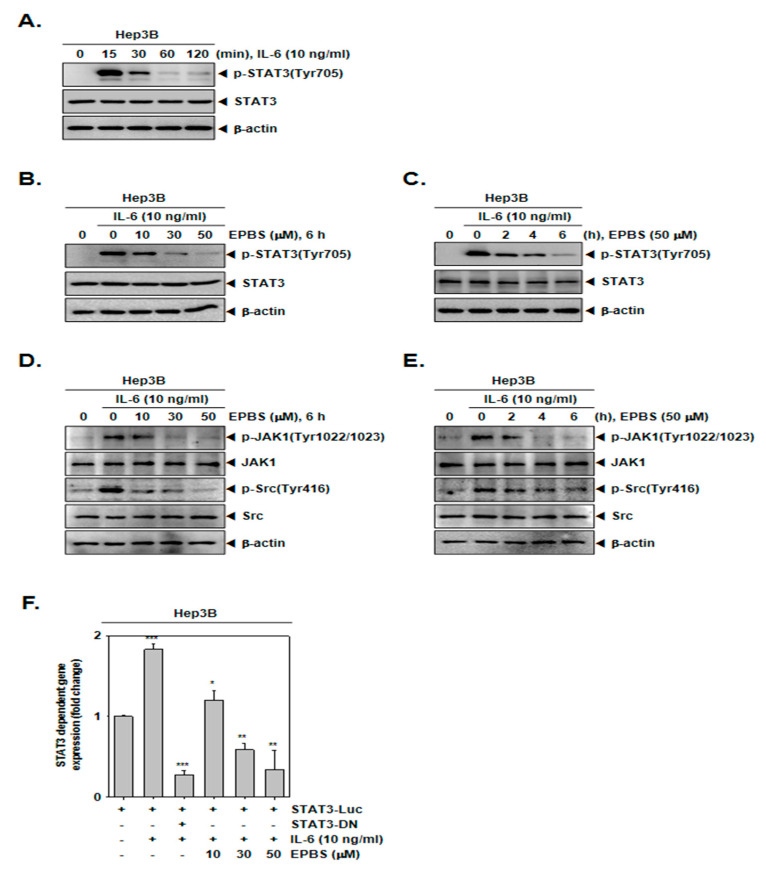
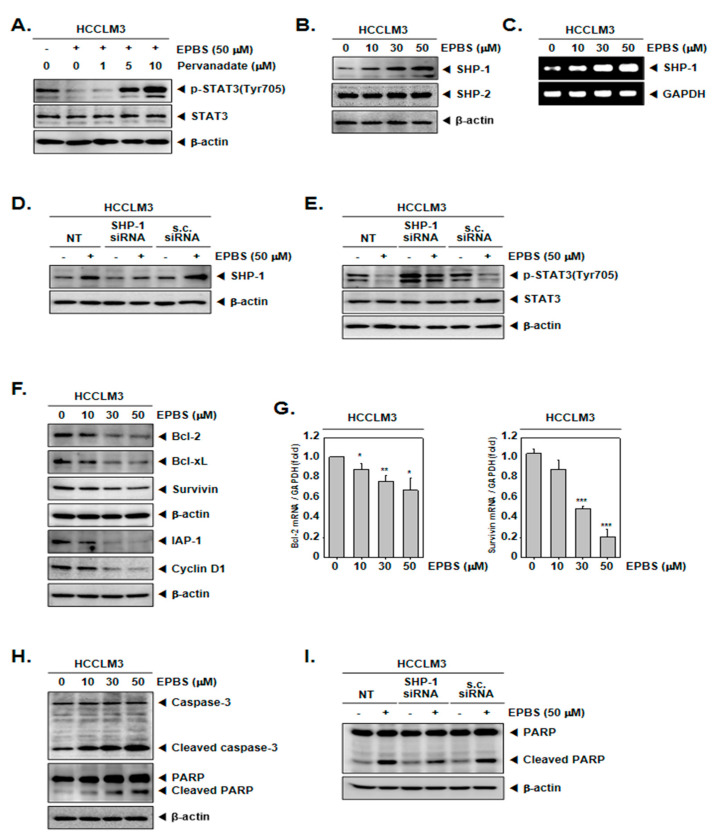
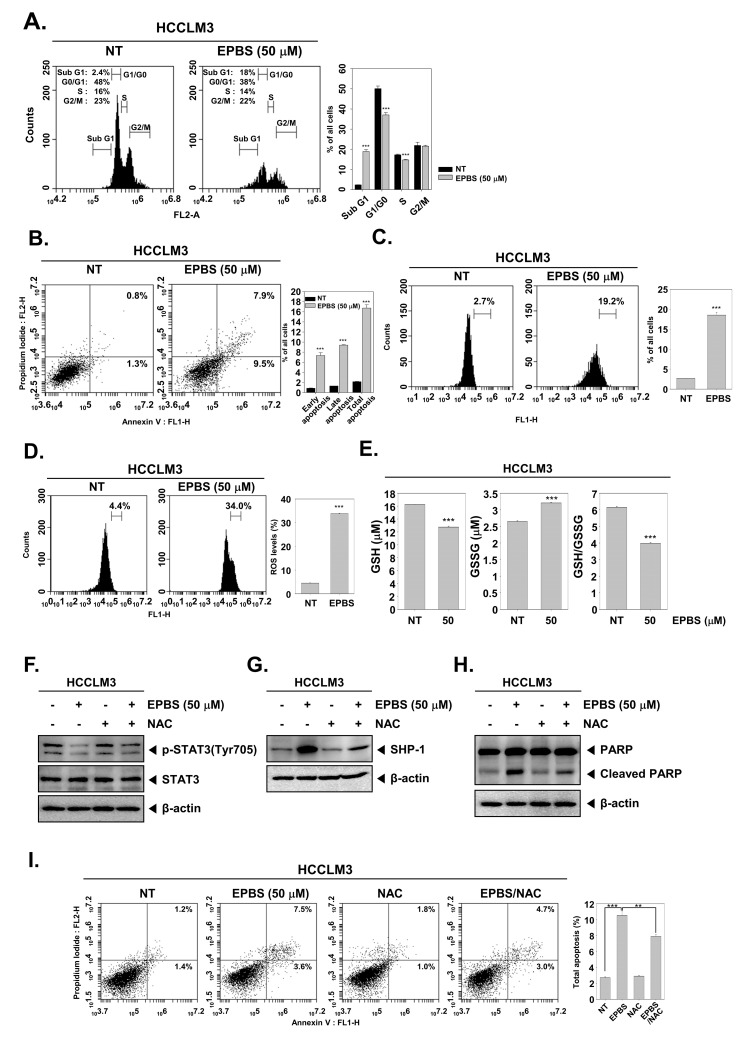
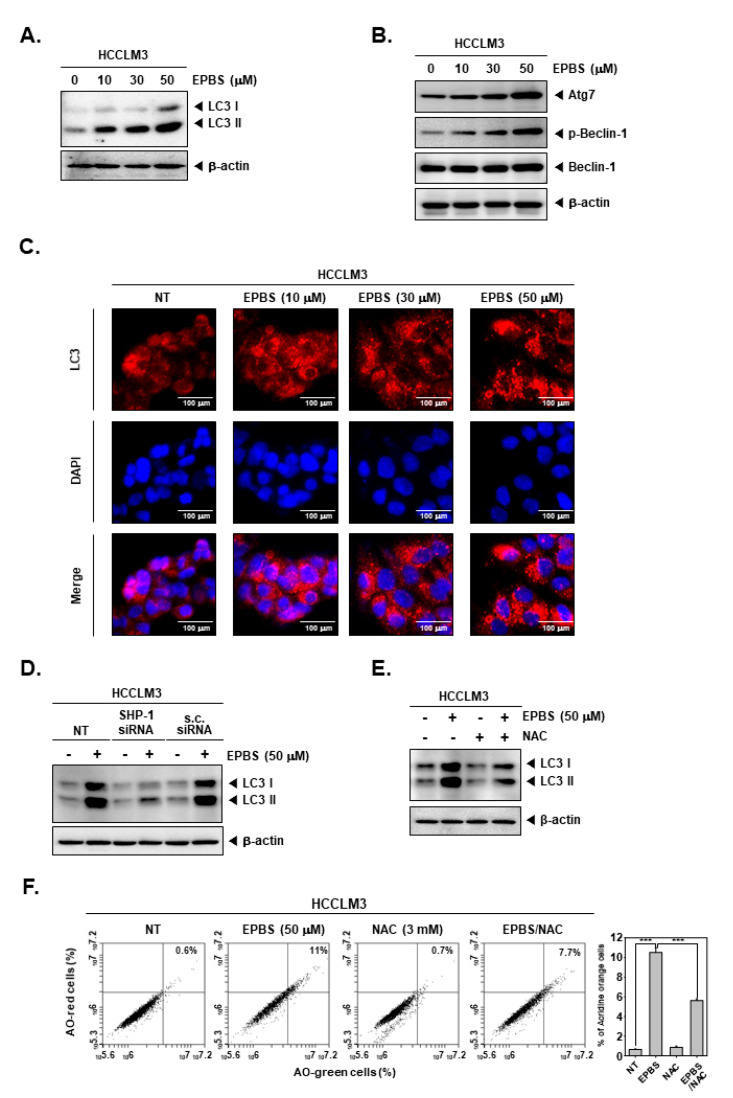
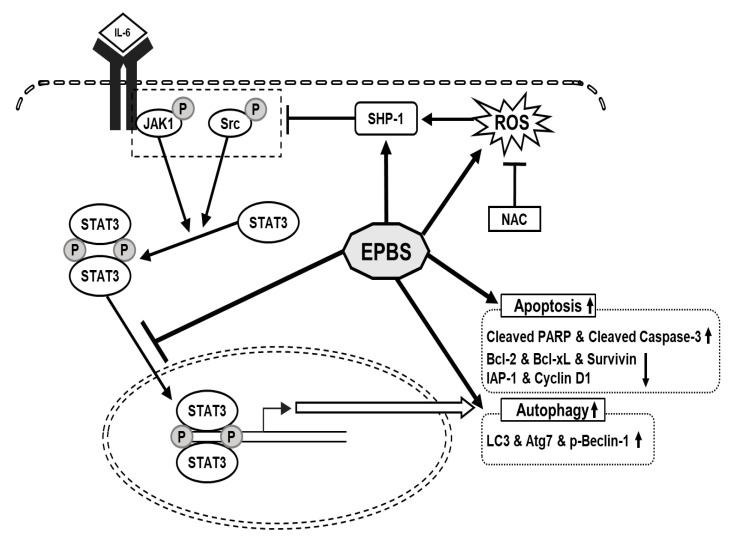
Euphorbiasteroid (EPBS) has gained attention for its activity against human lung cancer and sarcoma; however, its impact on hepatocellular carcinoma has not yet been elucidated. Here, we investigated the cytotoxic effect of EPBS on human hepatocellular carcinoma (HCC) cells. We found that EPBS induced both apoptosis and autophagy in HCC cells. Additionally, we observed that EPBS treatment suppressed the constitutive as well as the inducible activation of a signal transducer and activator of transcription 3 (STAT3) protein expression. Moreover, EPBS promoted the expression of SHP-1 protein and the production of reactive oxidative stress (ROS). Furthermore, the knockdown of SHP-1 by siRNA transfection reversed the effects of EPBS, which have inductive effects related to apoptosis and autophagy. Therefore, EPBS can potentially function as an anti-cancer agent by inducing apoptosis and autophagy when targeting the SHP-1/STAT3 pathway.

Keywords: SHP-1; STAT3; apoptosis; autophagy; euphorbiasteroid.


Conflict of interest statement

The authors declare no conflict of interest.

Figures

Figure 1
Figure 1
EPBS exhibited a cytotoxic effect and down–regulated the JAK/Src/STAT3 pathway. (A) The chemical structure of EPBS. (B) MTT assay was performed for measuring cell viability. HCCLM3 and Hep3B cells were treated with EPBS for 24 h. *** p < 0.001 and * p < 0.05 vs. non–treated (NT) cells. (C,D) HCCLM3 cells were treated with the indicated concentration of EPBS for the indicated time intervals. A Western blot analysis was performed to confirm protein levels. (E,F) HCCLM3 cells were treated with EPBS (0–10–30–50 µM or 50 µM) for 6 h or 0–2–4–6 h and an EMSA assay was performed. Oct–1 was used for a control. (G) HCCLM3 cells were incubated with 0–50 µM of EPBS for 6 h and an ICC assay was conducted. DAPI staining was conducted to detect cell nuclei. (H,I) HCCLM3 cells were treated with 0–10–30–50 µM of EPBS for 6 h, or treated with 50 µM EPBS for 0–2–4–6 h. The cells were harvested, lysed, and then a Western blot analysis was thereafter conducted. Abbreviations: Euphorbiasteroid (EPBS); Janus kinase 1 (JAK1); signal transducer and activator of transcription 3 (STAT3).
Figure 2
Figure 2
EPBS suppressed IL-6-stimulated STAT3 activation. (A) Hep3B cells were treated with 10 ng/mL of IL-6 for 0–15–30–60–120 min and Western blot analysis was performed. (B) Hep3B cells were pre–treated with the indicated concentration of EPBS for 6 h and then stimulated by 10 ng/mL IL-6 for 15 min, and Western blot analysis was conducted. (C) Hep3B cells were treated with EPBS (50 µM) for 0–2–4–6 h and then stimulated by IL-6 (10 ng/mL) for 15 min. The cells were harvested, lysed, and Western blot analysis was conducted. (D) The cells were treated with EPBS for 6 h and then treated with IL-6 for 15 min. (E) The cells were treated with EPBS and then IL-6 for the indicated time intervals. (F) Hep3B cells were transfected with STAT3 promoter luciferase for 24 h, then treated with EPBS (0–10–30–50 µM) for 6 h and stimulated with IL-6 for 15 min in a refreshed medium. STAT3-DN was used as a negative control. *** p < 0.001, ** p < 0.01, and * p < 0.05 vs. STAT3 promoter luciferase-transfected cells. Abbreviations: Euphorbiasteroid (EPBS); Interleukin-6 (IL-6); Janus kinase 1 (JAK1); signal transducer and activator of transcription 3 (STAT3).
Figure 3
Figure 3
EPBS increased levels of various proteins. (A) HCCLM3 cells were co-treated with 50 µM of EPBS and 0–1–5–10 µM of pervanadate for 6 h. Thereafter, a Western blot analysis was conducted. (B,C) HCCLM3 cells were treated with EPBS (0–10–30–50 µM) for 6 h. Western blotting and RT-PCR were carried out. (D,E) HCCLM3 cells were transfected with SHP-1 siRNA (50 nM) for 24 h and EPBS (50 µM) was treated for 6 h. Protein levels of SHP-1 and p-STAT3 were obtained by conducting a Western blot analysis. Scrambled siRNA (s.c. siRNA) was used for controls of transfection. (F,G) The cells were treated with 0–10–30–50 µM of EPBS for 24 h, and then collected. Western blot analysis was conducted to assess the expression level of the anti–apoptotic proteins, and real-time qPCR was performed to obtain the mRNA levels. *** p < 0.001, ** p < 0.01, and * p < 0.05 vs. non–treated (NT) cells. (H) EPBS was treated for 24 h and Western blotting was done. (I) HCCLM3 cells were transfected with SHP-1 siRNA (50 nM) for 24 h and then treated with 50 µM of EPBS for 24 h. Western blot analysis was carried out. Abbreviations: Euphorbiasteroid (EPBS); Janus kinase 1 (JAK1); scrambled siRNA (s.c. siRNA); signal transducer and activator of transcription 3 (STAT3).
Figure 4
Figure 4
EPBS–induced cell death through ROS production. (AC) HCCLM3 cells were treated with EPBS for 24 h and fixed EtOH. Cell cycle analysis, Annexin/PI staining analysis, and TUNEL assay were performed. *** p < 0.001 vs. non-treated (NT) cells. (D) HCCLM3 cells were treated with EPBS for 12 h, and the treated cells were reacted with H2DCFH-DA for 30 min at 37 °C. *** p < 0.001 vs. non-treated (NT) cells. (E) The cells were incubated with EPBS (50 µM) for 24 h and GSH/GSSG assay was conducted according to the manufacturer’s instructions. Luminescence was measured using luminescence readers. *** p < 0.001 vs. non–treated (NT) cells. (F,G) The cells were treated with 50 µM of EPBS or 3 mM of NAC for 6 h. (H,I) HCCLM3 cells were treated with EPBS or NAC (3 mM) for 24 h. Thereafter, Western blotting and Annexin/PI staining analysis were performed. *** p < 0.001 and ** p < 0.01 vs. EPBS–treated cells. Abbreviations: Euphorbiasteroid (EPBS); glutathione (GSH); N-acetyl-l-cysteine (NAC); signal transducer and activator of transcription 3 (STAT3).
Figure 5
Figure 5
EPBS induced autophagy activations through ROS production and SHP-1. (A,B) HCCLM3 cells were treated with EPBS for 24 h and Western blot analysis was performed. (C) HCCLM3 cells were incubated with EPBS for 24 h. Then, immunocytochemistry was conducted for the purpose of analyzing LC3 puncta. DAPI was used for detecting nuclei. (D) HCCLM3 cells were transfected with SHP-1 siRNA (50 nM) for 24 h and with EPBS for 24 h, and then Western blotting was performed. (E,F) HCCLM3 cells were treated with 50 µM of EPBS or 3 mM of NAC for 24 h, and were then collected. Thereafter, Western blot analysis and AO staining assay were performed. *** p < 0.001 vs. EPBS-treated cells. Abbreviations: Euphorbiasteroid (EPBS); N-acetyl-l-cysteine (NAC); scrambled siRNA (s.c. siRNA).
Figure 6
Figure 6
The schematic diagram of the anti-cancer effect of EPBS. EPBS induced ROS and SHP-1. Also, EPBS inhibited phosphorylation of STAT3 through inhibition of JAK1 and Src. As a result, EPBS induced apoptosis and autophagy, leading to cell death. Abbreviations: Euphorbiasteroid (EPBS); Interleukin-6 (IL-6); Janus kinase 1 (JAK1); N-acetyl-l-cysteine (NAC); reactive oxidative stress (ROS); signal transducer and activator of transcription 3 (STAT3).

Similar articles

Cited by

References

    1. Hashemi M., Sabouni E., Rahmanian P., Entezari M., Mojtabavi M., Raei B., Zandieh M.A., Behroozaghdam M., Mirzaei S., Hushmandi K., et al. Deciphering STAT3 signaling potential in hepatocellular carcinoma: Tumorigenesis, treatment resistance, and pharmacological significance. Cell Mol. Biol. Lett. 2023;28:33. doi: 10.1186/s11658-023-00438-9. - DOI - PMC - PubMed
    1. Huang B., Lang X., Li X. The role of IL-6/JAK2/STAT3 signaling pathway in cancers. Front. Oncol. 2022;12:1023177. doi: 10.3389/fonc.2022.1023177. - DOI - PMC - PubMed
    1. Li X., Jiang W., Dong S., Li W., Zhu W., Zhou W. STAT3 Inhibitors: A Novel Insight for Anticancer Therapy of Pancreatic Cancer. Biomolecules. 2022;12:1450. doi: 10.3390/biom12101450. - DOI - PMC - PubMed
    1. Dinakar Y.H., Kumar H., Mudavath S.L., Jain R., Ajmeer R., Jain V. Role of STAT3 in the initiation, progression, proliferation and metastasis of breast cancer and strategies to deliver JAK and STAT3 inhibitors. Life Sci. 2022;309:120996. doi: 10.1016/j.lfs.2022.120996. - DOI - PubMed
    1. Wong G.L., Manore S.G., Doheny D.L., Lo H.W. STAT family of transcription factors in breast cancer: Pathogenesis and therapeutic opportunities and challenges. Pt 3Semin. Cancer Biol. 2022;86:84–106. doi: 10.1016/j.semcancer.2022.08.003. - DOI - PMC - PubMed

LinkOut - more resources