

Regional Gene Expression in the Retina, Optic Nerve Head, and Optic Nerve of Mice with Optic Nerve Crush and Experimental Glaucoma
- PMID: 37762022
- PMCID: PMC10531004
- DOI: 10.3390/ijms241813719
Regional Gene Expression in the Retina, Optic Nerve Head, and Optic Nerve of Mice with Optic Nerve Crush and Experimental Glaucoma
Abstract
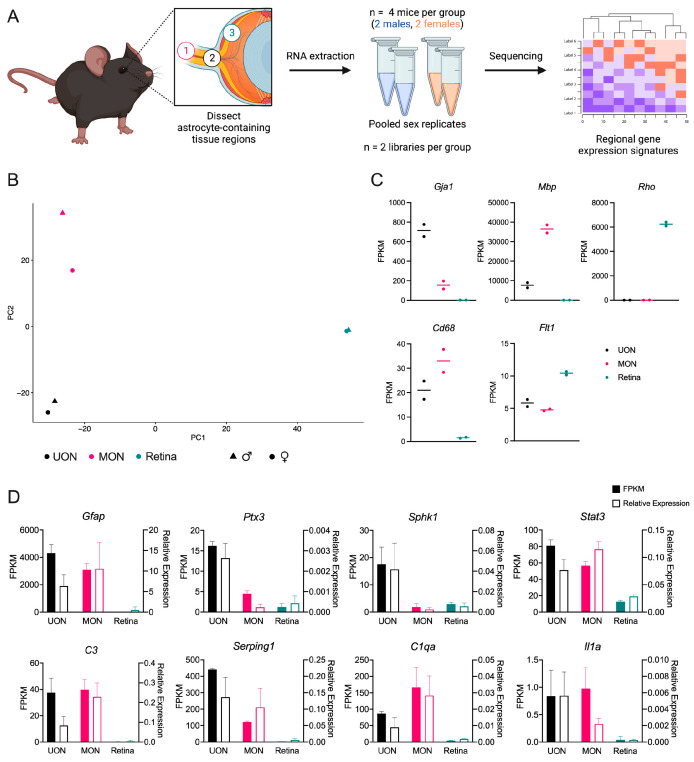
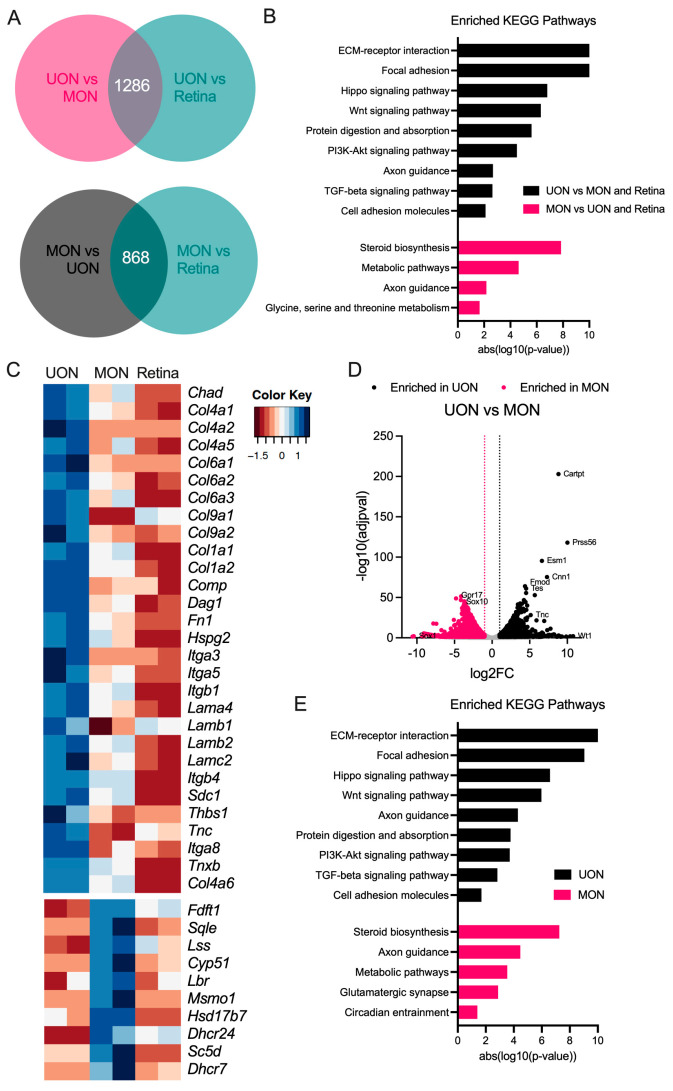
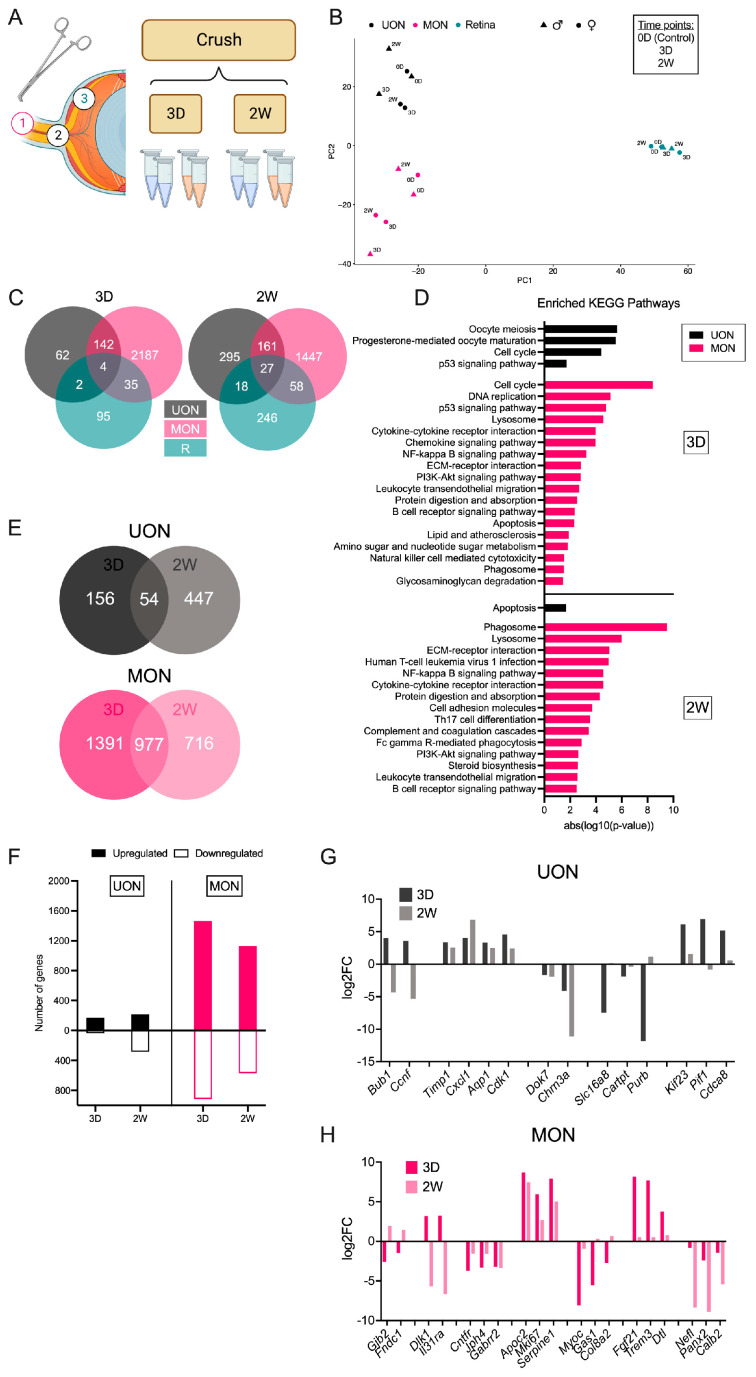
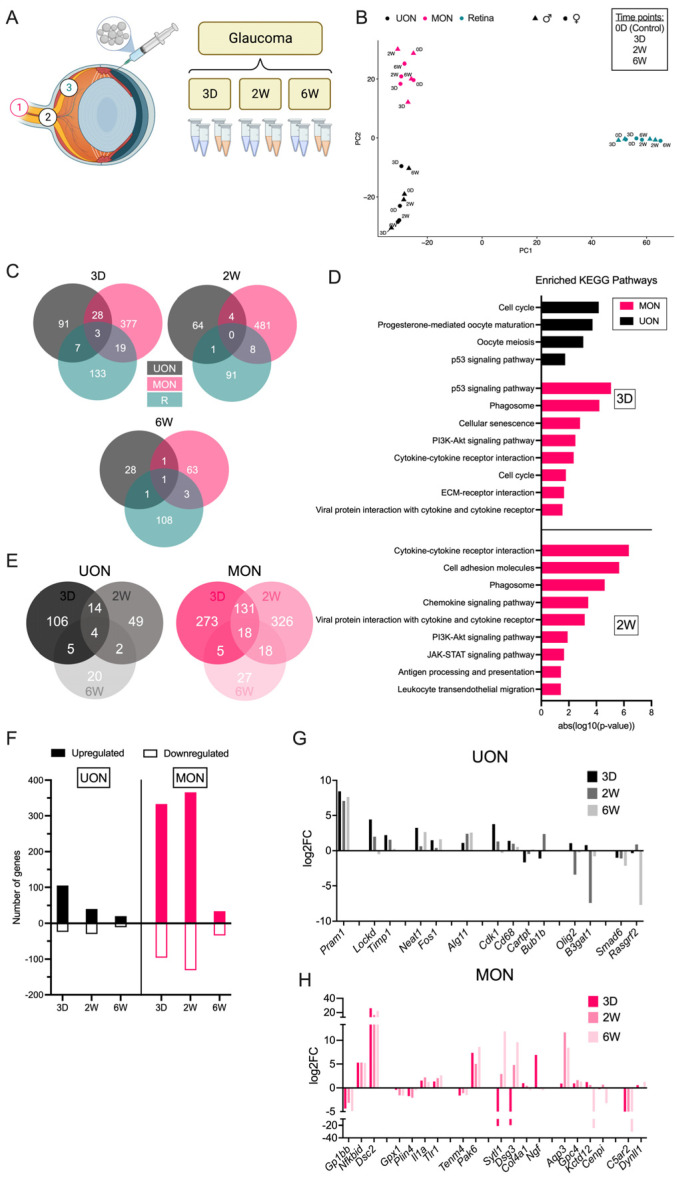
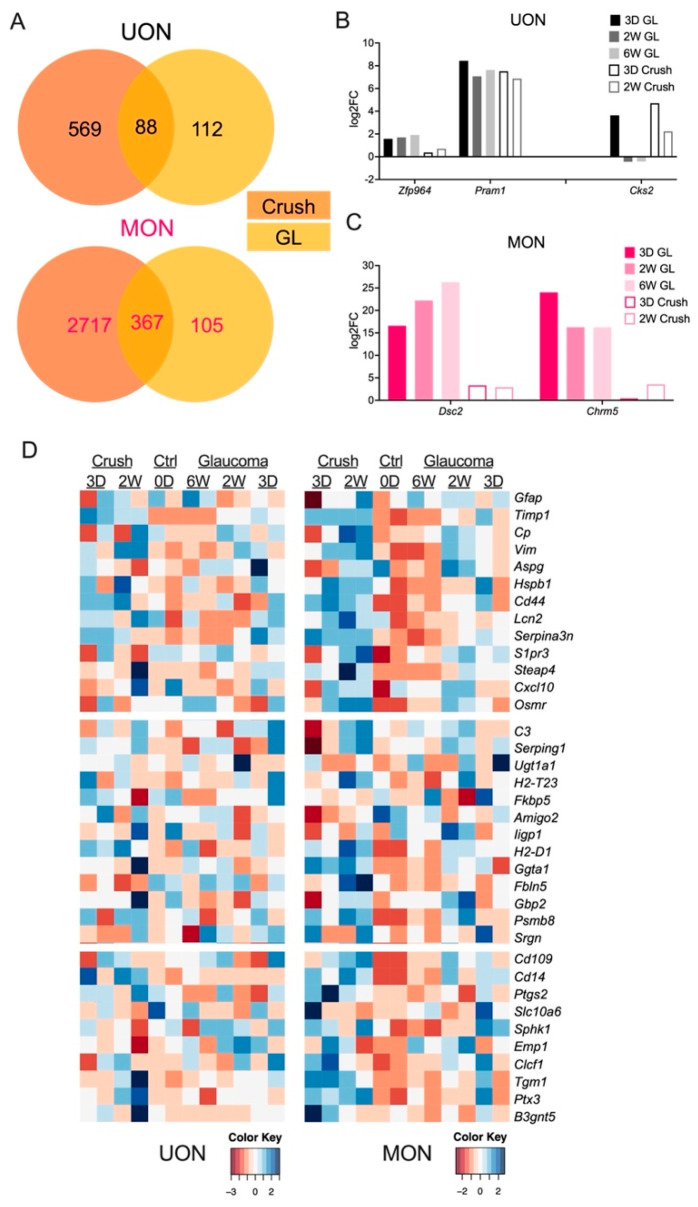
A major risk factor for glaucomatous optic neuropathy is the level of intraocular pressure (IOP), which can lead to retinal ganglion cell axon injury and cell death. The optic nerve has a rostral unmyelinated portion at the optic nerve head followed by a caudal myelinated region. The unmyelinated region is differentially susceptible to IOP-induced damage in rodent models and human glaucoma. While several studies have analyzed gene expression changes in the mouse optic nerve following optic nerve injury, few were designed to consider the regional gene expression differences that exist between these distinct areas. We performed bulk RNA-sequencing on the retina and separately micro-dissected unmyelinated and myelinated optic nerve regions from naïve C57BL/6 mice, mice after optic nerve crush, and mice with microbead-induced experimental glaucoma (total = 36). Gene expression patterns in the naïve unmyelinated optic nerve showed significant enrichment of the Wnt, Hippo, PI3K-Akt, and transforming growth factor β pathways, as well as extracellular matrix-receptor and cell membrane signaling pathways, compared to the myelinated optic nerve and retina. Gene expression changes induced by both injuries were more extensive in the myelinated optic nerve than the unmyelinated region, and greater after nerve crush than glaucoma. Changes present three and fourteen days after injury largely subsided by six weeks. Gene markers of reactive astrocytes did not consistently differ between injury states. Overall, the transcriptomic phenotype of the mouse unmyelinated optic nerve was significantly different from immediately adjacent tissues, likely dominated by expression in astrocytes, whose junctional complexes are inherently important in responding to IOP elevation.
Keywords: astrocytes; gene expression; glaucoma; mouse; nerve crush; optic nerve; retina; transcriptomics.
Conflict of interest statement
The authors declare no conflict of interest.
Figures
Update of
-
Regional Gene Expression in the Retina, Optic Nerve Head, and Optic Nerve of Mice with Experimental Glaucoma and Optic Nerve Crush.bioRxiv [Preprint]. 2023 May 25:2023.02.21.529410. doi: 10.1101/2023.02.21.529410. bioRxiv. 2023. Update in: Int J Mol Sci. 2023 Sep 06;24(18):13719. doi: 10.3390/ijms241813719. PMID: 36993314 Free PMC article. Updated. Preprint.
Similar articles
-
Regional Gene Expression in the Retina, Optic Nerve Head, and Optic Nerve of Mice with Experimental Glaucoma and Optic Nerve Crush.bioRxiv [Preprint]. 2023 May 25:2023.02.21.529410. doi: 10.1101/2023.02.21.529410. bioRxiv. 2023. Update in: Int J Mol Sci. 2023 Sep 06;24(18):13719. doi: 10.3390/ijms241813719. PMID: 36993314 Free PMC article. Updated. Preprint.
-
The role of aquaporin-4 in optic nerve head astrocytes in experimental glaucoma.PLoS One. 2021 Feb 2;16(2):e0244123. doi: 10.1371/journal.pone.0244123. eCollection 2021. PLoS One. 2021. PMID: 33529207 Free PMC article.
-
A method to quantify regional axonal transport blockade at the optic nerve head after short term intraocular pressure elevation in mice.Exp Eye Res. 2020 Jul;196:108035. doi: 10.1016/j.exer.2020.108035. Epub 2020 Apr 27. Exp Eye Res. 2020. PMID: 32353427 Free PMC article.
-
Adaptive responses to neurodegenerative stress in glaucoma.Prog Retin Eye Res. 2021 Sep;84:100953. doi: 10.1016/j.preteyeres.2021.100953. Epub 2021 Feb 25. Prog Retin Eye Res. 2021. PMID: 33640464 Free PMC article. Review.
-
[Aiming for zero blindness].Nippon Ganka Gakkai Zasshi. 2015 Mar;119(3):168-93; discussion 194. Nippon Ganka Gakkai Zasshi. 2015. PMID: 25854109 Review. Japanese.
Cited by
-
The Mechanisms of Neuroprotection by Topical Rho Kinase Inhibition in Experimental Mouse Glaucoma and Optic Neuropathy.Invest Ophthalmol Vis Sci. 2024 Nov 4;65(13):43. doi: 10.1167/iovs.65.13.43. Invest Ophthalmol Vis Sci. 2024. PMID: 39565302 Free PMC article.
-
Functional significance of commonly regulated genes in mechanically and chemically induced retinal ganglion cell death in rat eyes.Sci Rep. 2025 Jul 2;15(1):23681. doi: 10.1038/s41598-025-09503-z. Sci Rep. 2025. PMID: 40604065 Free PMC article.
-
Comparison of the Biomechanics of the Mouse Astrocytic Lamina Cribrosa Between Glaucoma and Optic Nerve Crush Models.Invest Ophthalmol Vis Sci. 2023 Dec 1;64(15):14. doi: 10.1167/iovs.64.15.14. Invest Ophthalmol Vis Sci. 2023. PMID: 38088825 Free PMC article.
-
Cellular senescence mediates retinal ganglion cell survival regulation post-optic nerve crush injury.Cell Prolif. 2024 Dec;57(12):e13719. doi: 10.1111/cpr.13719. Epub 2024 Jul 18. Cell Prolif. 2024. PMID: 39021340 Free PMC article.
-
Emerging strategies targeting genes and cells in glaucoma.Vision Res. 2025 Feb;227:108533. doi: 10.1016/j.visres.2024.108533. Epub 2024 Dec 6. Vision Res. 2025. PMID: 39644708 Review.
References
-
- Howell G.R., Libby R.T., Jakobs T.C., Smith R.S., Phalan F.C., Barter J.W., Barbay J.M., Marchant J.K., Mahesh N., Porciatti V., et al. Axons of retinal ganglion cells are insulted in the optic nerve early in DBA/2J glaucoma. J. Cell Biol. 2007;179:1523–1537. doi: 10.1083/jcb.200706181. - DOI - PMC - PubMed
MeSH terms
Substances
Grants and funding
LinkOut - more resources
Full Text Sources
Medical
Molecular Biology Databases
