Observational Study
. 2023 Sep 7;24(18):13779.
doi: 10.3390/ijms241813779.

Oral Iron Absorption of Ferric Citrate Hydrate and Hepcidin-25 in Hemodialysis Patients: A Prospective, Multicenter, Observational Riona-Oral Iron Absorption Trial

Affiliations
Observational Study

Oral Iron Absorption of Ferric Citrate Hydrate and Hepcidin-25 in Hemodialysis Patients: A Prospective, Multicenter, Observational Riona-Oral Iron Absorption Trial

Naohisa Tomosugi et al. Int J Mol Sci. .

Abstract

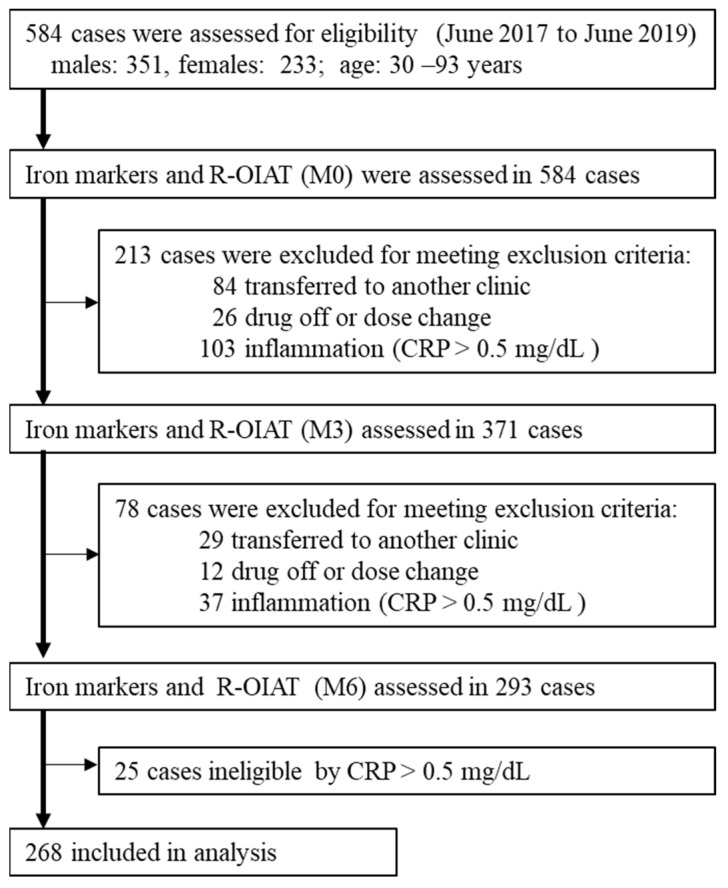
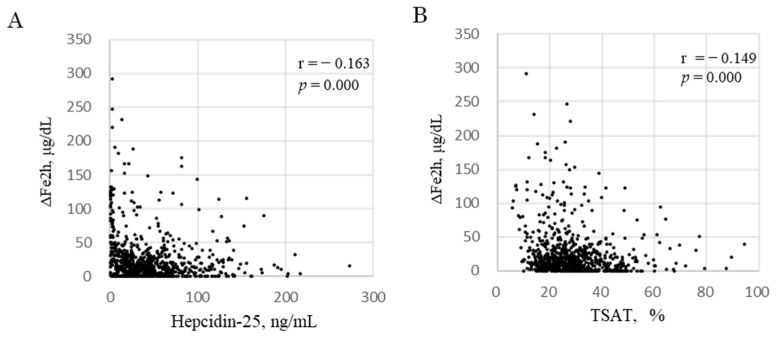
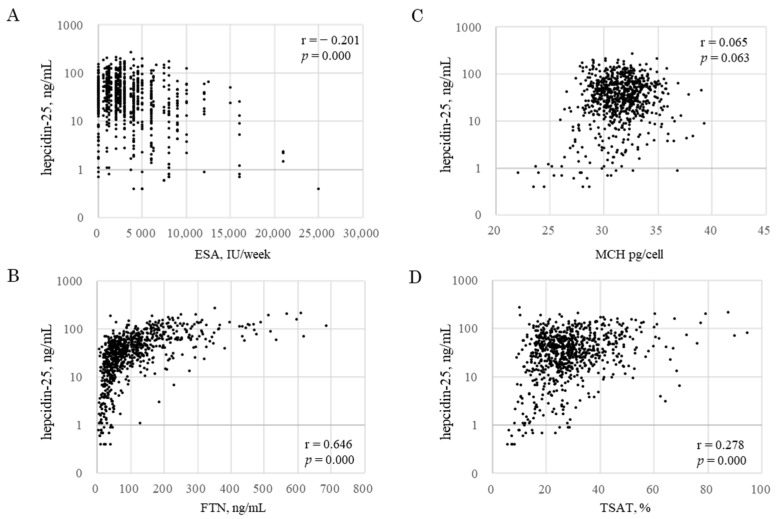
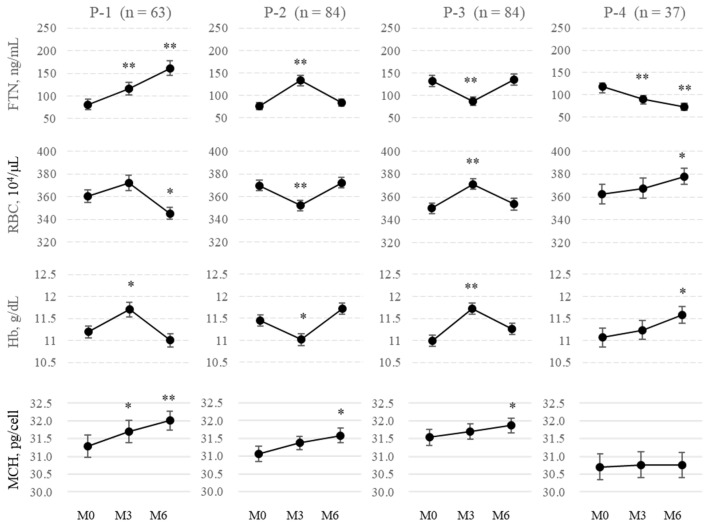
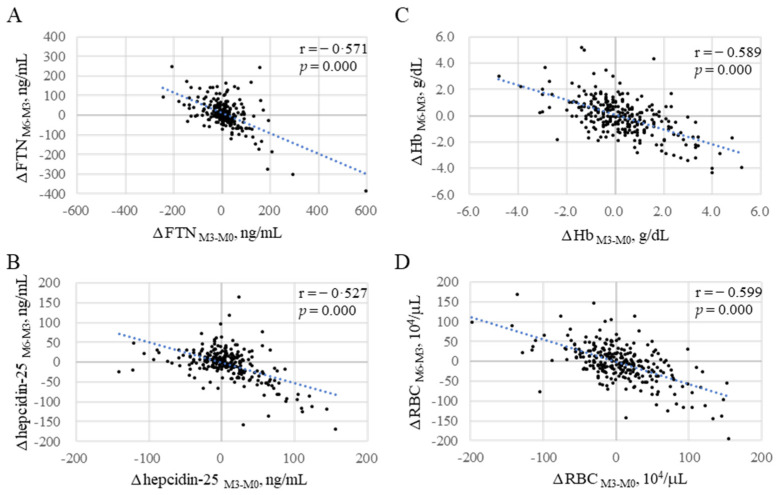
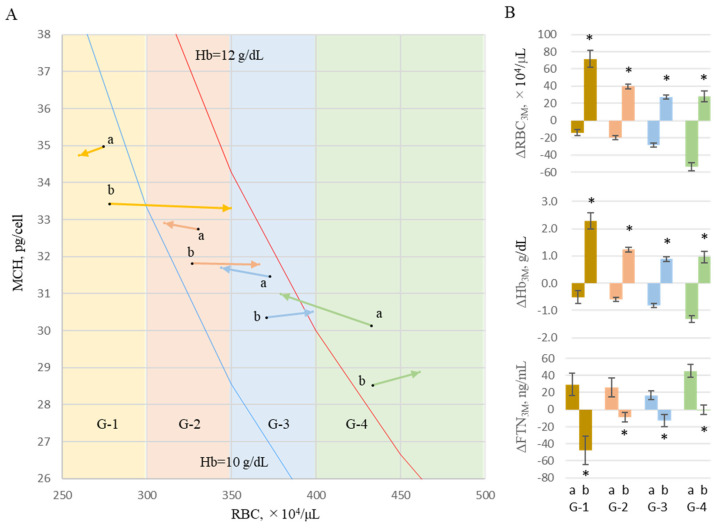
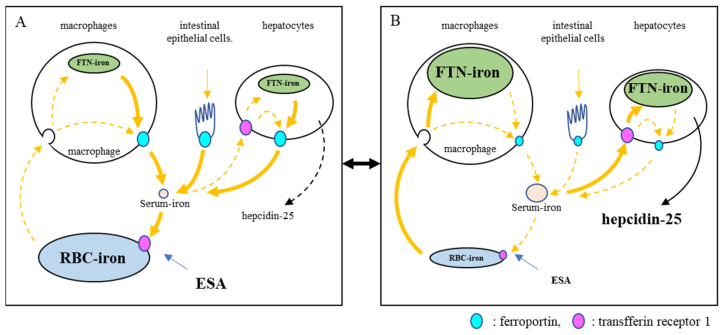
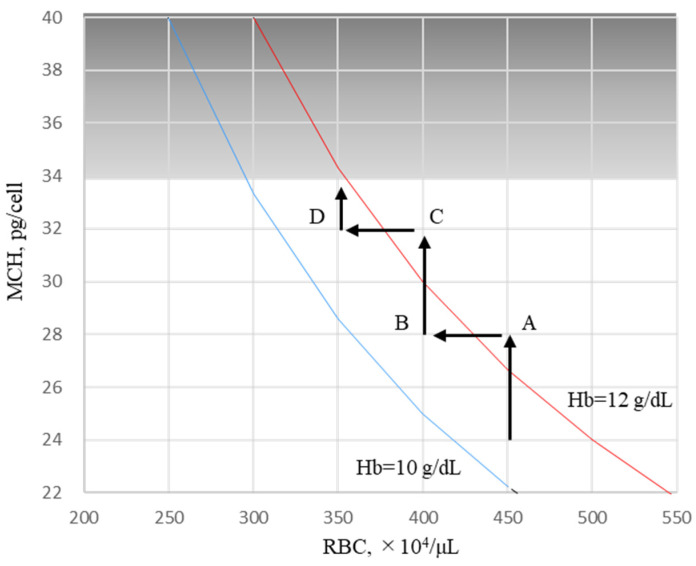
Oral ferric citrate hydrate (FCH) is effective for iron deficiencies in hemodialysis patients; however, how iron balance in the body affects iron absorption in the intestinal tract remains unclear. This prospective observational study (Riona-Oral Iron Absorption Trial, R-OIAT, UMIN 000031406) was conducted at 42 hemodialysis centers in Japan, wherein 268 hemodialysis patients without inflammation were enrolled and treated with a fixed amount of FCH for 6 months. We assessed the predictive value of hepcidin-25 for iron absorption and iron shift between ferritin (FTN) and red blood cells (RBCs) following FCH therapy. Serum iron changes at 2 h (ΔFe2h) after FCH ingestion were evaluated as iron absorption. The primary outcome was the quantitative delineation of iron variables with respect to ΔFe2h, and the secondary outcome was the description of the predictors of the body's iron balance. Generalized estimating equations (GEEs) were used to identify the determinants of iron absorption during each phase of FCH treatment. ΔFe2h increased when hepcidin-25 and TSAT decreased (-0.459, -0.643 to -0.276, p = 0.000; -0.648, -1.099 to -0.197, p = 0.005, respectively) in GEEs. FTN increased when RBCs decreased (-1.392, -1.749 to -1.035, p = 0.000) and hepcidin-25 increased (0.297, 0.239 to 0.355, p = 0.000). Limiting erythropoiesis to maintain hemoglobin levels induces RBC reduction in hemodialysis patients, resulting in increased hepcidin-25 and FTN levels. Hepcidin-25 production may prompt an iron shift from RBC iron to FTN iron, inhibiting iron absorption even with continued FCH intake.

Keywords: ferric citrate hydrate; hemodialysis; hepcidin-25; iron shift; oral iron absorption.


Conflict of interest statement

Tomosugi is a professor at Kanazawa Medical University and the president of Medical Care Proteomics Biotechnology Co., Ltd. However, this association did not alter the authors’ adherence to all policies regarding the sharing of data. The authors have declared that no conflict of interest exist.

Figures

Figure 1
Figure 1
Flow chart depicting the study’s population selection.
Figure 2
Figure 2
Correlation between ΔFe2h and hepcidin-25 and TSAT. Correlation between ΔFe2h and hepcidin-25 (A) and TSAT (B). The data included all samples from 268 patients at M0, M3, and M6 during FCH therapy for 6 months (black dots, n = 804). ΔFe2h, iron absorption; MCH, mean corpuscular hemoglobin. ΔFe2h, iron absorption in 2 h; TSAT, transferrin saturation.
Figure 3
Figure 3
Correlation between hepcidin-25 and iron markers. Correlation between hepcidin-25 and ESA (A), FTN (B), MCH (C), and TSAT (D). Data included all samples from 268 patients at M0, M3, and M6 during FCH therapy for 6 months (block dots, n = 804). ESA, erythropoiesis-stimulating agent; FTN, ferritin; MCH, mean corpuscular hemoglobin; TSAT, transferrin saturation.
Figure 4
Figure 4
Changes in FTN and iron variables every three months (n = 268). Patients were classified into four groups based on 3-month changes in FTN from M0 to M3 or from M3 to M6 (denoted as ΔFTNM3-M0 and ΔFTNM6-M3, respectively); P-1 (ΔFTNM3-M0: positive; ΔFTNM6-M3: positive; n = 63), P-2 (ΔFTNM3-M0: positive; ΔFTNM6-M3: negative; n = 84), P-3 (ΔFTNM3-M0: negative; ΔFTNM6-M3: positive; n = 84), and P-4 (ΔFTNM3-M0: negative; ΔFTNM6-M3: negative; n = 37). FTN, Ferritin; RBCs, red blood cells; Hb, hemoglobin; MCH, mean corpuscular hemoglobin. Data are shown as means ± SEM of samples. The levels of iron variables at M0 were compared with those at M3 and M6. * p < 0.05. ** p < 0.001.
Figure 5
Figure 5
Inverse correlations between the changes in iron variables from M0 to M3 and those from M3 to M6 (black dots, n = 268). (A): ΔFTNM3-M0 vs. ΔFTNM6-M3; (B): ΔRBCM3-M0 vs. ΔRBCM6-M3; (C): ΔHbM3-M0 vs. ΔHbM6-M3; (D): ΔHEPM3-M0 vs. Δhepcidin-25M6-M3. Only 63 cases (23.5%) were positive for both ΔFTNM3-M0 and Δ FTNM6-M3. ΔM3-M0: Changes from M0 to M3; ΔM6-M3: changes from M3 to M6. FTN, ferritin; Hb, hemoglobin; RBCs, red blood cells. The blue dotted line describes the regression line.
Figure 6
Figure 6
Effects of RBCs on changes in FTN. To analyze the effect of the change in RBC counts on FTN values over 3 months, the levels at M0 and M3 were treated as starting points for the first and second 3-month periods, and levels at M3 and M6 were treated as 3-month points, respectively. Two datasets of iron variables were evaluated equally, and the changes in iron variables over 3 months were represented as Δ3M (n = 536). Each case was classified into 4 groups, G-1, G-2, G-3, and G-4, according to the RBC value at start points (M0 and M3): RBC ≤ 300, 300 < RBC ≤ 350, 350 < RBC ≤ 400 and RBC > 400 × 104/μL, respectively. Furthermore, each case was classified into G-a when each ΔRBC3M was negative and G-b when positive. (A) The start and end points were vectorized as the mean values of MCH and RBCs. Hb 10g/dL-line (blue) and Hb 12g/dL-line (red) are shown based on the formula Hb = RBC × MCH. (B) The levels of ΔFTN3M were presented in each group. Data are shown as mean ± SEM of samples. RBCs, red blood cells; MCH, mean corpuscular hemoglobin; Hb, hemoglobin; FTN, ferritin. The levels of G-a were compared with those of G-b. * p < 0.05.
Figure 7
Figure 7
Model of crosstalk between the erythropoietic system and iron metabolic system. The stimulation of erythropoiesis by ESA is a trigger for crosstalk. When ESA stimulates hematopoiesis (A), serum iron is rapidly consumed and decreases. This triggers a decrease in the expression of hepcidin-25. Iron is then supplied from iron-store cells via FPN. If the supply of iron recovered from senescent red blood cells alone is inadequate, stored iron is consumed. This phenomenon appears to be a shift from FTN iron to RBC iron. In this situation, iron is readily absorbed from the intestinal tract. When erythropoiesis decreases due to the limitation of ESA (B), serum iron increases because of reduced iron consumption in bone marrow, and hepcidin-25 also increases. As a result, the iron supply to blood is suppressed, and unsupplied iron is stored in cells. Iron recovered from senescent red blood cells is also stored. This appears to be a shift from RBC iron to FTN iron. In this situation, iron absorption from the intestinal tract is suppressed. FTN, ferritin; ESA, erythropoiesis-stimulating agent; RBCs, red blood cells.
Figure 8
Figure 8
Hypothesis of Hb adjustment shown in the RBC/MCH diagram during FCH therapy. When the Hb level is ≥12 g/dL, ESA is arbitrarily reduced, and Hb levels are adjusted between 10 and 12 g/dL according to the guidelines. Hb level, which was 13 g/dL in RBC 450 × 104/μL (MCH 28.9 pg, point A), was reduced to 11.6 g/dL when reducing ESA and resetting RBCs to 400 × 104/μL (point B). During this period, the FTN level increased because RBC iron’s capacity decreased, and the corresponding amount of iron shifted to FTN iron. When FCH administration was continued, MCH increased with iron absorption, and Hb levels easily exceeded 12 g/dL (RBC to 400 × 104/μL, MCH 32.5 pg, point C). If ESA was reduced again and RBCs reset to 350 × 104/μL, Hb levels improved to 11.4 g/dL (point D) with another increase in the FTN level. When RBCs are ≤ 350 × 104/μL, there is little risk of Hb being ≥12 g/dL even if FCH therapy is continued because there is an upper limit against MCH, which falls normally within the range of 27–33 pg. At this stage, there is no need to further reduce the ESA, and FTN reaches a plateau without increasing. Hb, hemoglobin; RBCs, red blood cells; MCH, mean corpuscular hemoglobin; FCH, ferric citrate hydrate; ESA, erythropoiesis-stimulating agent.

Similar articles

Cited by

References

    1. Fishbane S., Spinowitz B. Update on anemia in ESRD and earlier stages of CKD: Core curriculum 2018. Am. J. Kidney Dis. 2018;71:423–435. doi: 10.1053/j.ajkd.2017.09.026. - DOI - PubMed
    1. Besarab A., Coyne D.W. Iron supplementation to treat anemia in patients with chronic kidney disease. Nat. Rev. Nephrol. 2010;6:699–710. doi: 10.1038/nrneph.2010.139. - DOI - PubMed
    1. Pergola P.E., Fishbane S., Ganz T. Novel oral iron therapies for iron deficiency anemia in chronic kidney disease. Adv. Chronic Kidney Dis. 2019;26:272–291. doi: 10.1053/j.ackd.2019.05.002. - DOI - PubMed
    1. Yokoyama K., Akiba T., Fukagawa M., Nakayama M., Sawada K., Kumagai Y., Chertow G.M., Hirakata H. Long-term safety and efficacy of a novel iron-containing phosphate binder, JTT-751, in patients receiving hemodialysis. J. Ren. Nutr. 2014;24:261–267. doi: 10.1053/j.jrn.2014.03.006. - DOI - PubMed
    1. Lewis J.B., Sika M., Koury M.J., Chuang P., Schulman G., Smith M.T., Whittier F.C., Linfert D.R., Galphin C.M., Athreya B.P., et al. Ferric citrate controls phosphorus and delivers iron in patients on dialysis. J. Am. Soc. Nephrol. 2015;26:493–503. doi: 10.1681/ASN.2014020212. - DOI - PMC - PubMed

Publication types

LinkOut - more resources