. 2023 Sep 7;24(18):13801.
doi: 10.3390/ijms241813801.

A Case Study from the Past: "The RGC-5 vs. the 661W Cell Line: Similarities, Differences and Contradictions-Are They Really the Same?"

Affiliations

A Case Study from the Past: "The RGC-5 vs. the 661W Cell Line: Similarities, Differences and Contradictions-Are They Really the Same?"

José Hurst et al. Int J Mol Sci. .

Abstract

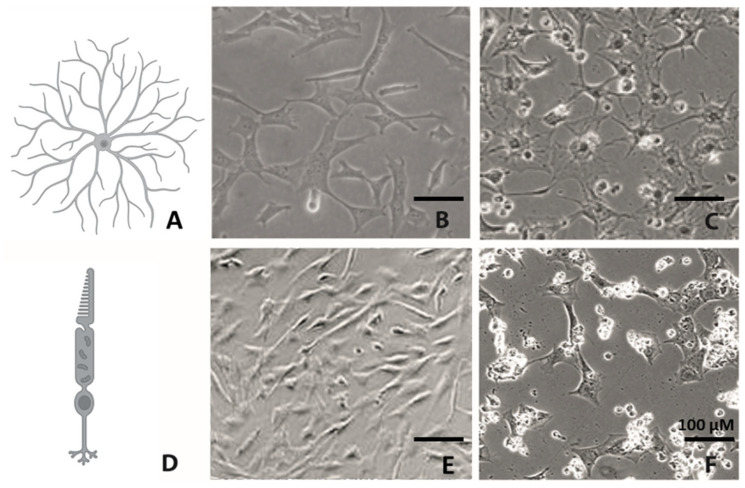
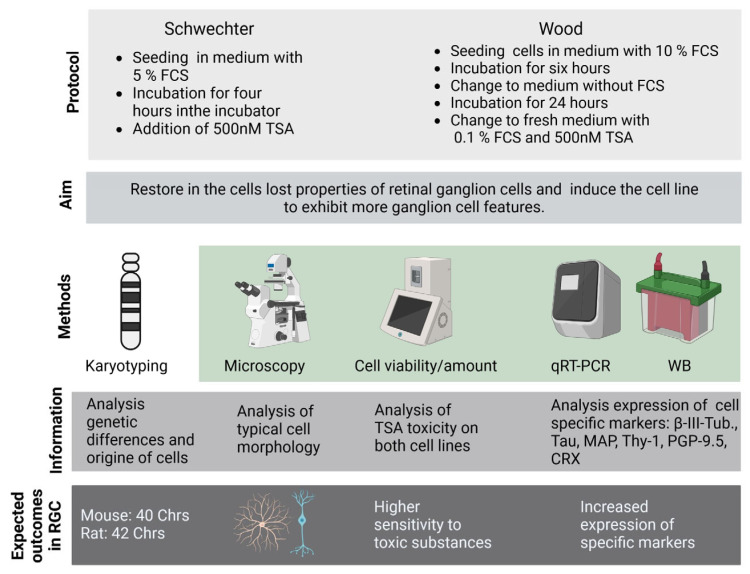
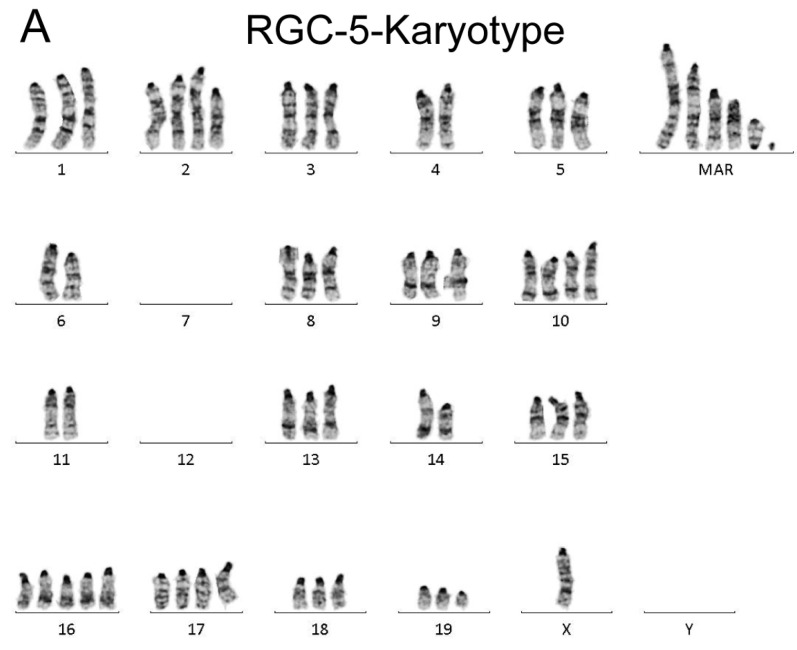
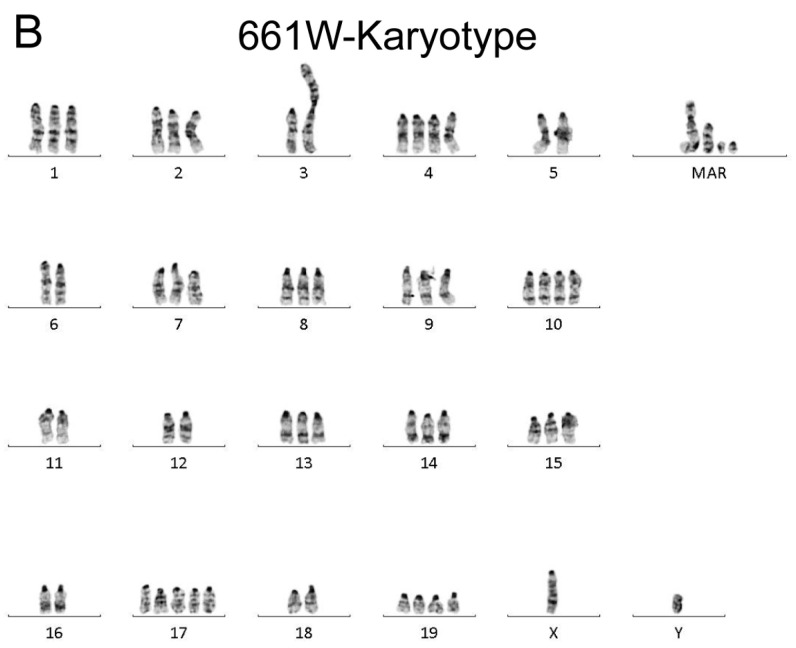
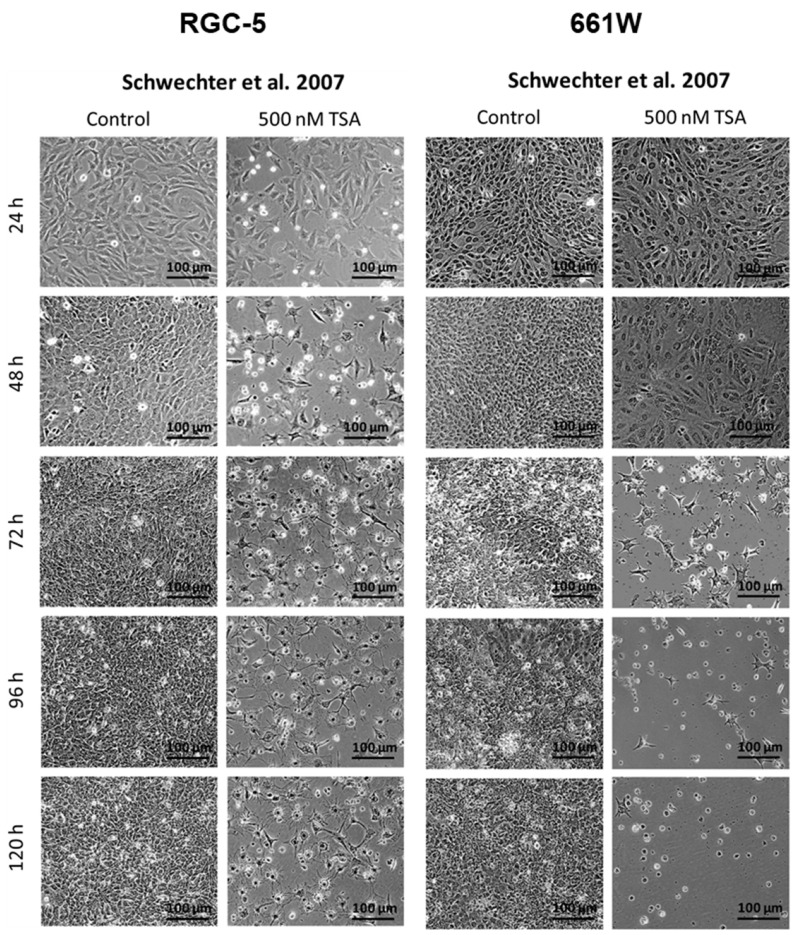
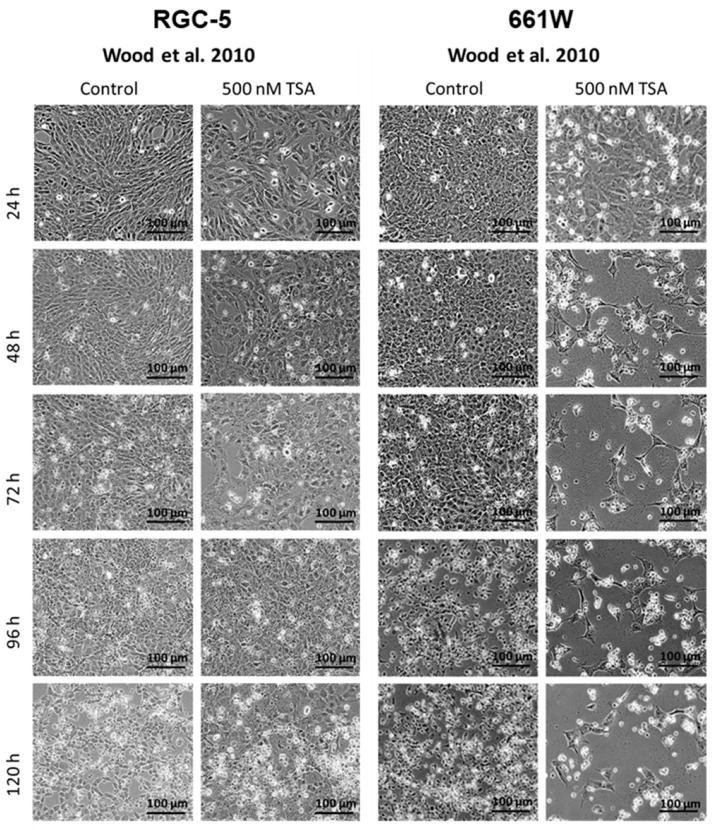
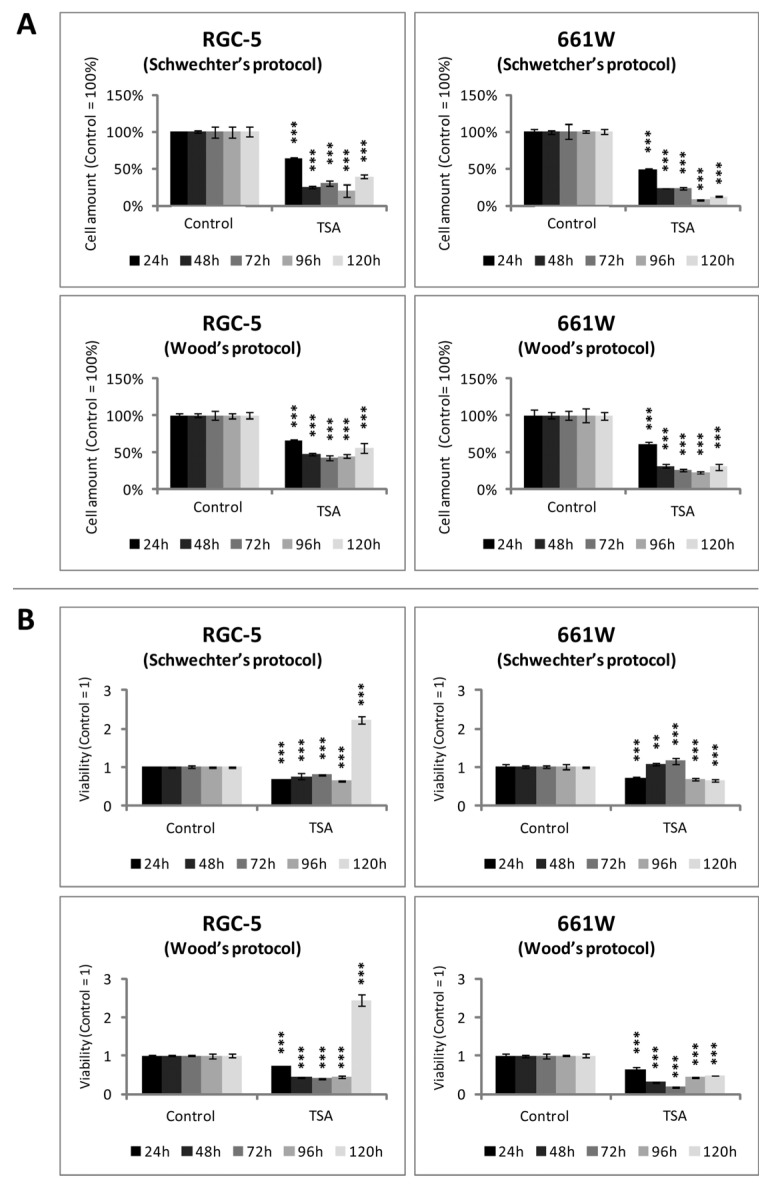
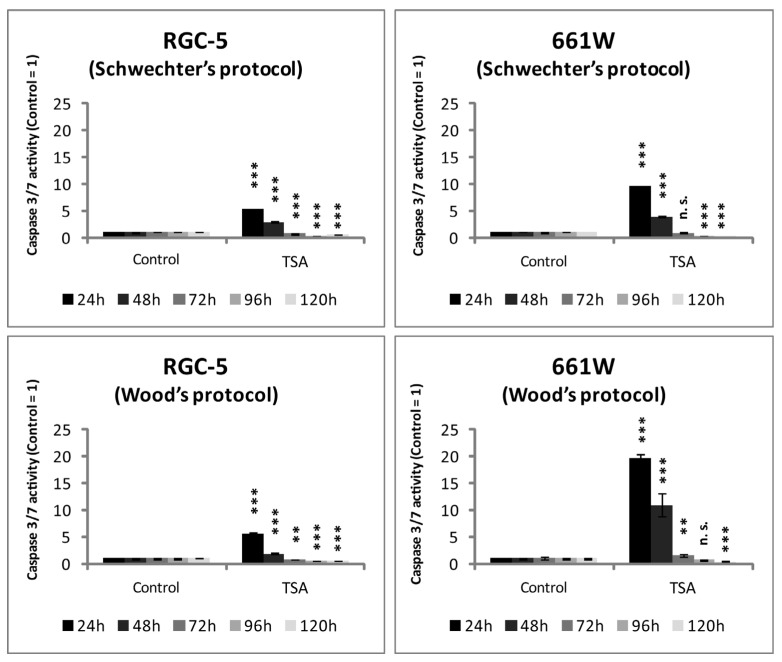
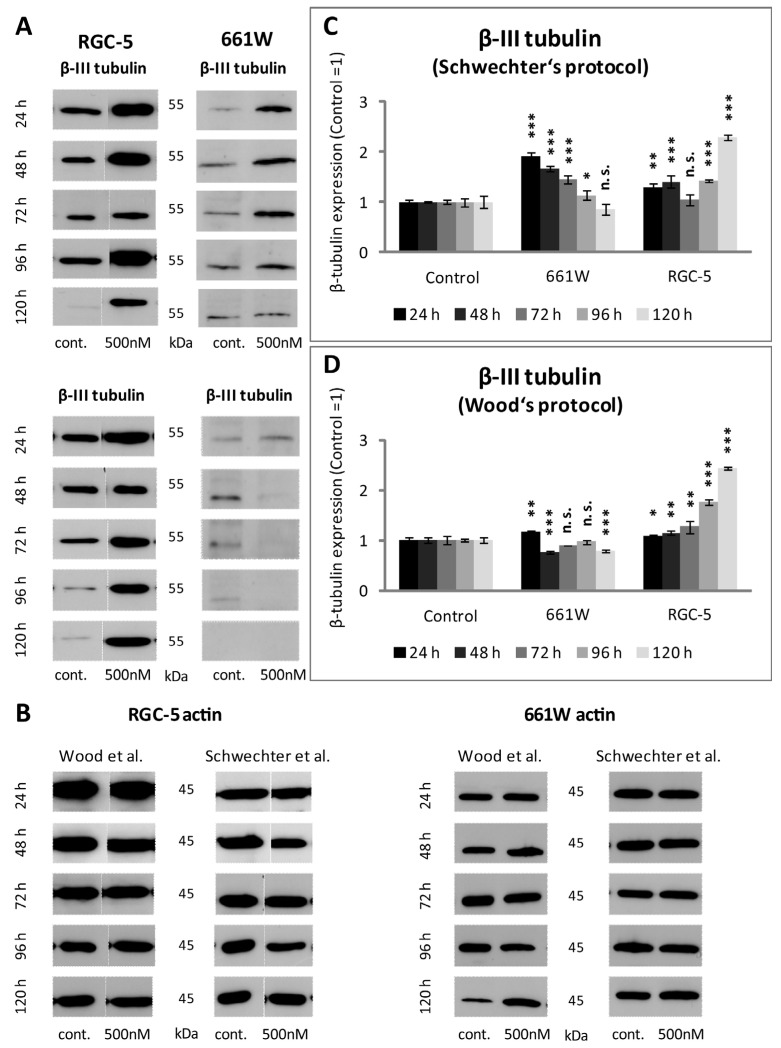
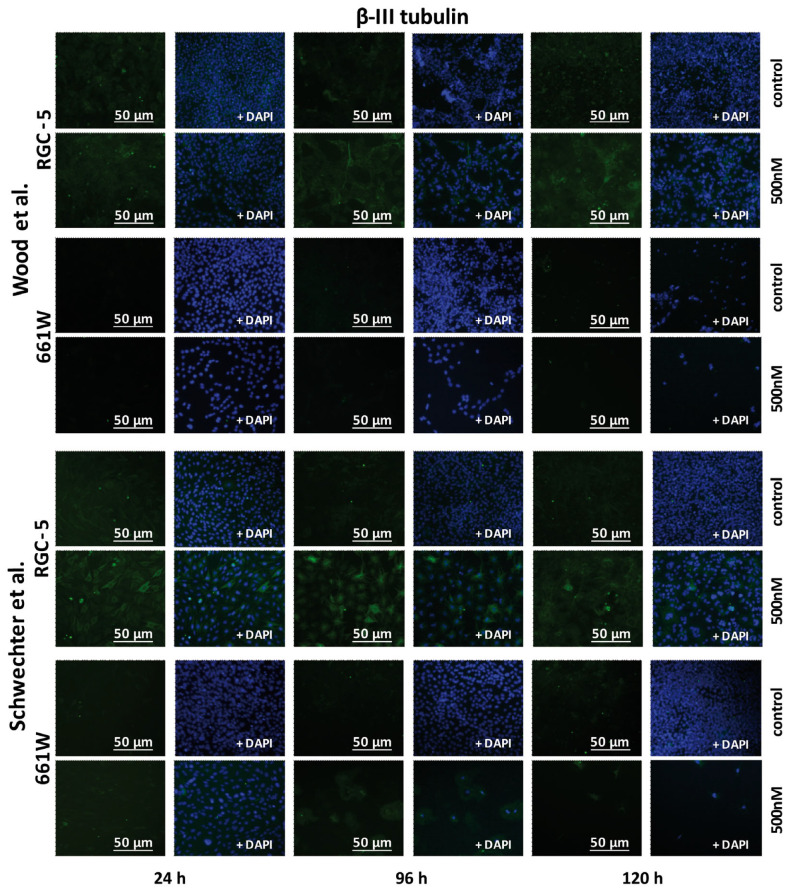
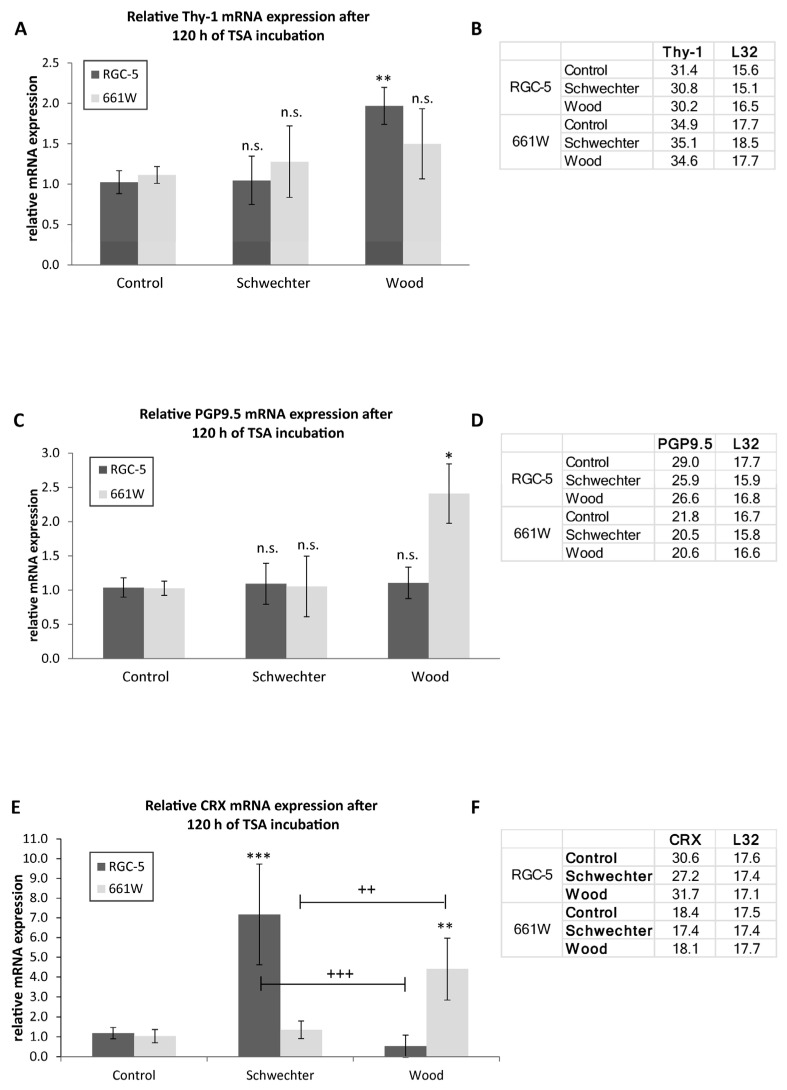
In the pursuit of identifying the underlying pathways of ocular diseases, the use of cell lines such as (retinal ganglion cell-5) RGC-5 and 661W became a valuable tool, including pathologies like retinal degeneration and glaucoma. In 2001, the establishment of the RGC-5 cell line marked a significant breakthrough in glaucoma research. Over time, however, concerns arose about the true nature of RGC-5 cells, with conflicting findings in the literature regarding their identity as retinal ganglion cells or photoreceptor-like cells. This study aimed to address the controversy surrounding the RGC-5 cell line's origin and properties by comparing it with the 661W cell line, a known cone photoreceptor model. Both cell lines were differentiated according to two prior published redifferentiation protocols under the same conditions using 500 nM of trichostatin A (TSA) and investigated for their morphological and neuronal marker properties. The results demonstrated that both cell lines are murine, and they exhibited distinct morphological and neuronal marker properties. Notably, the RGC-5 cells showed higher expression of the neuronal marker β-III tubulin and increased Thy-1-mRNA compared with the 661W cells, providing evidence of their different properties. The findings emphasize the importance of verifying the authenticity of cell lines used in ocular research and highlight the risks of contamination and altered cell properties.

Keywords: RGC-5 & 661W; differentiation protocol; glaucoma.


Conflict of interest statement

The authors declare no conflict of interest.

Figures

Figure 1
Figure 1
Morphology of RGC and cones and their potential cell lines. Schematic diagram of a retinal ganglion cell, modified from [26] (A). Phase contrast microscopy of undifferentiated RGC-5 cells in culture (B). RGC-5 cells after 96 h of differentiation with 500 nM TSA according to Schwechter et al. [16] (C). Schematic diagram of a photo receptor, modified from [27] (D). Untreated 661W cells in culture shortly after 24 h of cultivation (E). The 661W cells 96 h after differentiation with 500 nM TSA according to Schwechter et al. [16] (F). Scale bar = 100 µM. Created with Biorender.com.
Figure 2
Figure 2
Comprehensive overview of the methods and the expected results. Abbreviations: Chr = chromosomes; FCS = fetal calf serum; qRT-PCR = quantitative real-time polymerase chain reaction; TSA = trichostatin A; and WB = Western blot. Created with BioRender.com.
Figure 3
Figure 3
Analysis of the karyotype of RGC5- and 661W cells. Example of exclusively murine chromosomes (GTG-banded) of the RGC-5 cell line (A). Example of exclusively murine chromosomes (GTG-banded) of the 661W cell line (B).
Figure 3
Figure 3
Analysis of the karyotype of RGC5- and 661W cells. Example of exclusively murine chromosomes (GTG-banded) of the RGC-5 cell line (A). Example of exclusively murine chromosomes (GTG-banded) of the 661W cell line (B).
Figure 4
Figure 4
Morphology changes in TSA-treated cells according to Schwechter’s protocol [16].
Figure 5
Figure 5
Morphology changes in TSA-treated cells according to Wood’s protocol [14].
Figure 6
Figure 6
Viability and cell amount of RGC-5 and 661W cells during TSA incubation. Bar graphs represent total amount of cells (A) and viability (B) of RGC-5 cells and 661W cells after 24, 48, 72, 96 and 120 h of supplementation with 500 nM TSA, expressed as arbitrary units with control set as one and 100%, respectively (n = 6). (A) Crystal violet staining showed a time-dependent decrease in cell amount in TSA-treated cultures of 661W and RGC-5 cells. The smallest amount of cells resulted after 96 and 120 h of incubation with 500 nM TSA using Schwechter’s protocol. (B) Cell viability decreased during the early days of TSA treatment. After 120 h, RGC-5 cells showed a distinct 2.5-fold increase no matter which protocol was used. The 661W cells did not show this increase. *** = p ≤ 0.001. ** = p ≤ 0.01.
Figure 7
Figure 7
Apoptosis in RGC-5 cells and 661W cells due to TSA treatment. Bar graphs demonstrate caspase activity measured by caspase 3/7 assay as arbitrary units with control set as one (n = 6). *** = p ≤ 0.001. ** = p ≤ 0.01. Here, n.s. = not significantly different from control.
Figure 8
Figure 8
β-III tubulin expression detected via Western blotting in RGC-5 and 661W cells after TSA. (A) Representative pictures of β-III tubulin levels in RGC-5 and 661W cells using Schwechter’s protocol (above) and Wood’s protocol (below) after 24 h, 48, 72, 96 and 120 h. (B) Representative blots of reference protein actin are shown (C) Bar graphs representing β-III tubulin levels measured by Western blotting after 24, 48, 72, 96 and 120 h under Schwechter’s protocol. After 24 h, the RGC-5 cells already revealed a significant increase in β-III tubulin expression, with the highest expression (2.4-fold) after 120 h (p < 0.0001). When the 661W cells were treated according to Schwechter’s protocol, an increase in β-III tubulin expression could be observed during the first days of incubation, but after 72 h, the values dropped again. (D) Quantification of β-III tubulin expression of RGC-5 and 661W cells when treated according to Wood’s protocol. The RGC-5 cells reacted the same as under Schwechter’s protocol, with a significant increase in β-III tubulin which augmented over the time, whereas the 661W cells expressed slightly more β-III tubulin after 24 and 48 h, but then the amount dropped again. Control set as one (n = 4). *** = p ≤ 0.001. ** = p ≤ 0.01. * = p ≤ 0.05. Here, n.s. = not significantly different from control [14,16].
Figure 9
Figure 9
β-III tubulin immunostaining of RGC-5 cells and 661W cells [14,16].
Figure 10
Figure 10
Detection of Thy-1, PGP9.5 and CRX mRNA expression. Relative Thy-1-mRNA expression in RGC-5 and 661W cells (A). Bar graphs picture relative mRNA expression of Thy-1 in RGC-5 and 661W cells incubated with 500 nM of TSA for 120 h as arbitrary units, with control set as one (n = 4). RGC-5 cells doubled the relative expression of Thy-1-mRNA after 120 h of TSA treatment according to Wood’s protocol, while when using Schwechter’s protocol, no difference from the control cells was observed. Thy-1 mRNA expression in 661W cells did significantly increase when treated with TSA, no matter which protocol was used. (B) The Thy-1 mRNA signal appeared at a CT of 30–31 in the RGC-5 cells. In the 661W cells, Thy-1 signals were later detected at a CT of 34–35. Since the same shift was observed in the housekeeping gene L32, no differences in the Thy-1 mRNA between the two cell line amounts were recordable. Relative PGP9.5 mRNA expression in RGC-5 and 661W cells (C). Bar graphs represent relative mRNA expression of PGP9.5 mRNA compared with control in RGC-5 and 661W cells incubated with 500 nM of TSA for 120 h as arbitrary units (n = 4). The 661W cells showed PGP9.5 mRNA expression two times higher after 120 h of TSA treatment according to Wood’s protocol, while no difference with the control cells was observed when using Schwechter’s protocol. Expression of PGP9.5 mRNA in RGC-5 cells did not significantly increase when treated with TSA. (D) The average PGP9.5 CT values were lower in the 661W cells (20–22) than in the RGC-5 cells, where the signal appeared at a CT of 25–27. The CT values for the housekeeping gene L32 were comparable in both cell lines, being between 15 and 17. This indicates a higher amount of PGP9.5 mRNA in the 661W cells. Relative CRX mRNA expression in RGC-5 and 661W cells (E). Bar graphs represent relative mRNA expression of CRX mRNA compared with control in RGC-5 and 661W cells incubated with 500 nM of TSA for 120 h as arbitrary units (n = 4). (F) The average CRX CT values were lower in the 661W cells (20–22) than in the RGC-5 cells, where the signal appeared at a CT of 25–27. The CT values for the housekeeping gene L32 were comparable in both cell lines, being between 15 and 17. * indicating differences to control group; + indicating differences between the two protocols. *** = p ≤ 0.001. ** = p ≤ 0.01. * = p ≤ 0.05. +++ = p ≤ 0.001. ++ = p ≤ 0.01. Here, n.s. = not significantly different from control.

Similar articles

Cited by

References

    1. Stitt A.W., Curtis T.M., Chen M., Medina R.J., McKay G.J., Jenkins A., Gardiner T.A., Lyons T.J., Hammes H.P., Simo R., et al. The progress in understanding and treatment of diabetic retinopathy. Prog. Retin. Eye Res. 2016;51:156–186. doi: 10.1016/j.preteyeres.2015.08.001. - DOI - PubMed
    1. United States Environmental Protection Agency . Directive to Prioritize Efforts to Reduce Animal Testing. United States Environmental Protection Agency; Washington, DC, USA: 2019.
    1. Schnichels S., Paquet-Durand F., Loscher M., Tsai T., Hurst J., Joachim S.C., Klettner A. Retina in a dish: Cell cultures, retinal explants and animal models for common diseases of the retina. Prog. Retin. Eye Res. 2021;81:100880. doi: 10.1016/j.preteyeres.2020.100880. - DOI - PubMed
    1. Krishnamoorthy R.R., Agarwal P., Prasanna G., Vopat K., Lambert W., Sheedlo H.J., Pang I.H., Shade D., Wordinger R.J., Yorio T., et al. Characterization of a transformed rat retinal ganglion cell line. Brain Res. Mol. Brain Res. 2001;86:112. doi: 10.1016/S0169-328X(00)00224-2. - DOI - PubMed
    1. Agarwal N., Agarwal R., Kumar D.M., Ondricek A., Clark A.F., Wordinger R.J., Pang I.H. Comparison of expression profile of neurotrophins and their receptors in primary and transformed rat retinal ganglion cells. Mol. Vis. 2007;13:1311–1318. - PubMed