

Effect of Soil Drought Stress on Selected Biochemical Parameters and Yield of Oat × Maize Addition (OMA) Lines
- PMID: 37762208
- PMCID: PMC10531036
- DOI: 10.3390/ijms241813905
Effect of Soil Drought Stress on Selected Biochemical Parameters and Yield of Oat × Maize Addition (OMA) Lines
Abstract
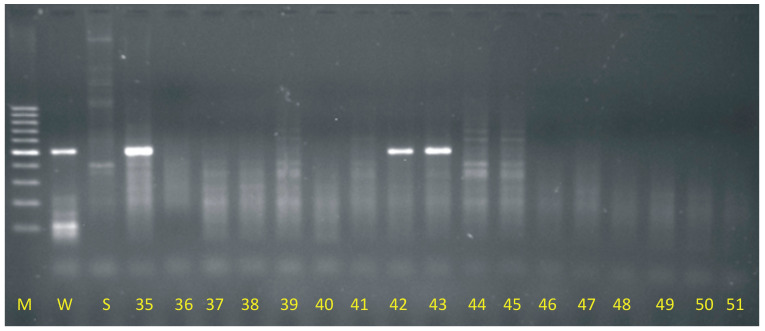
Plant growth and the process of yield formation in crops are moderated by surrounding conditions, as well as the interaction of the genetic background of plants and the environment. In the last two decades, significant climatic changes have been observed, generating unfavorable and harmful impacts on plant development. Drought stress can be considered one of the most dangerous environmental factors affecting the life cycle of plants, reducing biomass production and, finally, the yield. Plants can respond to water deficit in a wide range, which depends on the species, genetic variability within the species, the plant's ontogenesis stage, the intensity of the stress, and other potential stress factors. In plants, it is possible to observe hybrids between different taxa that certain traits adopted to tolerate stress conditions better than the parent plants. Oat × maize addition (OMA) plants are good examples of hybrids generated via wide crossing. They can exhibit morphological, physiological, and biochemical variations implemented by the occurrence of extra chromosomes of maize, as well as the interaction of maize and oat chromatin. The initial goal of the study was to identify OMA lines among plants produced by wide crossing with maize. The main goal was to investigate differences in OMA lines according to the Excised Leaf Water Loss (ELWL) test and to identify specific biochemical changes and agronomic traits under optimal water conditions and soil drought. Additionally, detection of any potential alterations that are stable in F2 and F3 generations. The aforementioned outcomes were the basis for the selection of OMA lines that tolerate growth in an environment with limited water availability. The molecular analysis indicated 12.5% OMA lines among all tested descendants of wide oat-maize crossing. The OMA lines significantly differ according to ELWL test results, which implies some anatomical and physiological adaptation to water loss from tissues. On the first day of drought, plants possessed 34% more soluble sugars compared to control plants. On the fourteen day of drought, the amount of soluble sugars was reduced by 41.2%. A significant increase of phenolic compounds was observed in the fourteen day of drought, an average of 6%, even up to 57% in line 9. Soil drought substantially reduced stem biomass, grains number, and mass per plant. Lower water loss revealed by results of the ELWL test correlated with the high yield of OMA lines. Phenolic compound content might be used as a biochemical indicator of plant drought tolerance since there was a significant correlation with the high yield of plants subjected to soil drought.
Keywords: Grande I; OMA; agronomic traits; drought stress; maize; oat; phenolic compounds; soluble sugars.
Conflict of interest statement
The authors declare no conflict of interest. The funders had no role in the design of the study, in the collection, analyses, or interpretation of data, in the writing of the manuscript, or in the decision to publish the results.
Figures


Similar articles
-
Functioning of the Photosynthetic Apparatus in Response to Drought Stress in Oat × Maize Addition Lines.Int J Mol Sci. 2020 Sep 22;21(18):6958. doi: 10.3390/ijms21186958. Int J Mol Sci. 2020. PMID: 32971899 Free PMC article.
-
Addition of individual chromosomes of maize inbreds B73 and Mo17 to oat cultivars Starter and Sun II: maize chromosome retention, transmission, and plant phenotype.Theor Appl Genet. 2009 Nov;119(7):1255-64. doi: 10.1007/s00122-009-1130-2. Epub 2009 Aug 26. Theor Appl Genet. 2009. PMID: 19707741
-
Complex characterization of oat (Avena sativa L.) lines obtained by wide crossing with maize (Zea mays L.).PeerJ. 2018 Jun 25;6:e5107. doi: 10.7717/peerj.5107. eCollection 2018. PeerJ. 2018. PMID: 29967749 Free PMC article.
-
Enhancing drought tolerance in C(4) crops.J Exp Bot. 2011 May;62(9):3135-53. doi: 10.1093/jxb/err105. Epub 2011 Apr 21. J Exp Bot. 2011. PMID: 21511912 Review.
-
Plant survival under drought stress: Implications, adaptive responses, and integrated rhizosphere management strategy for stress mitigation.Microbiol Res. 2021 Jan;242:126626. doi: 10.1016/j.micres.2020.126626. Epub 2020 Oct 18. Microbiol Res. 2021. PMID: 33189069 Review.
Cited by
-
Comparative characteristics of oat doubled haploids and oat × maize addition lines: Anatomical features of the leaves, chlorophyll a fluorescence and yield parameters.PLoS One. 2024 Apr 9;19(4):e0298072. doi: 10.1371/journal.pone.0298072. eCollection 2024. PLoS One. 2024. PMID: 38593116 Free PMC article.
-
Transcriptomic Characterization of Genes Harboring Markers Linked to Maize Yield.Genes (Basel). 2024 Nov 29;15(12):1558. doi: 10.3390/genes15121558. Genes (Basel). 2024. PMID: 39766825 Free PMC article.
-
The role of silver nanoparticles in yellow lupine (Lupinus luteus L.) defense response to Fusarium oxysporum f.sp. lupini.Sci Rep. 2025 May 8;15(1):16136. doi: 10.1038/s41598-025-00464-x. Sci Rep. 2025. PMID: 40341719 Free PMC article.
-
Transcriptomic Characterization of Candidate Genes for Fusarium Resistance in Maize (Zea mays L.).Pathogens. 2025 Aug 6;14(8):779. doi: 10.3390/pathogens14080779. Pathogens. 2025. PMID: 40872289 Free PMC article.
References
-
- Ji X., Shiran B., Wan J., Lewis D.C., Jenkins C.L.D., Condon A.G., Richards R.A., Dolferus R. Importance of pre-anthesis anther sink strength for maintenance of grain number during reproductive stage water stress in wheat. Plant Cell Environ. 2010;33:926–942. doi: 10.1111/j.1365-3040.2010.02130.x. - DOI - PubMed
-
- Thomas H. Drought resistance in plants. In: Basra A.S., Basra R.K., editors. Mechanisms of Environmental Stress Resistance in Plants. Harwood Academic Publishers; Amsterdam, The Netherlands: 1997. pp. 1–42.
MeSH terms
Substances
LinkOut - more resources
Full Text Sources
Miscellaneous
