. 2023 Sep 12;24(18):13982.
doi: 10.3390/ijms241813982.

Expression Analysis Reveals Differentially Expressed Genes in BPH and WBPH Associated with Resistance in Rice RILs Derived from a Cross between RP2068 and TN1

Affiliations

Expression Analysis Reveals Differentially Expressed Genes in BPH and WBPH Associated with Resistance in Rice RILs Derived from a Cross between RP2068 and TN1

Rashi Anand et al. Int J Mol Sci. .

Abstract

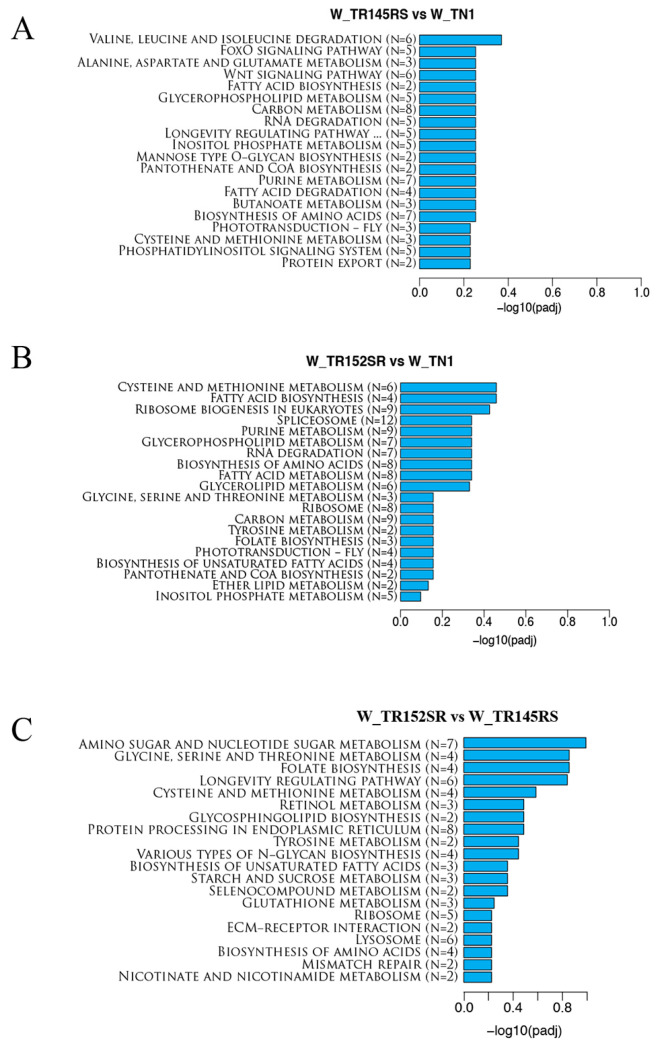
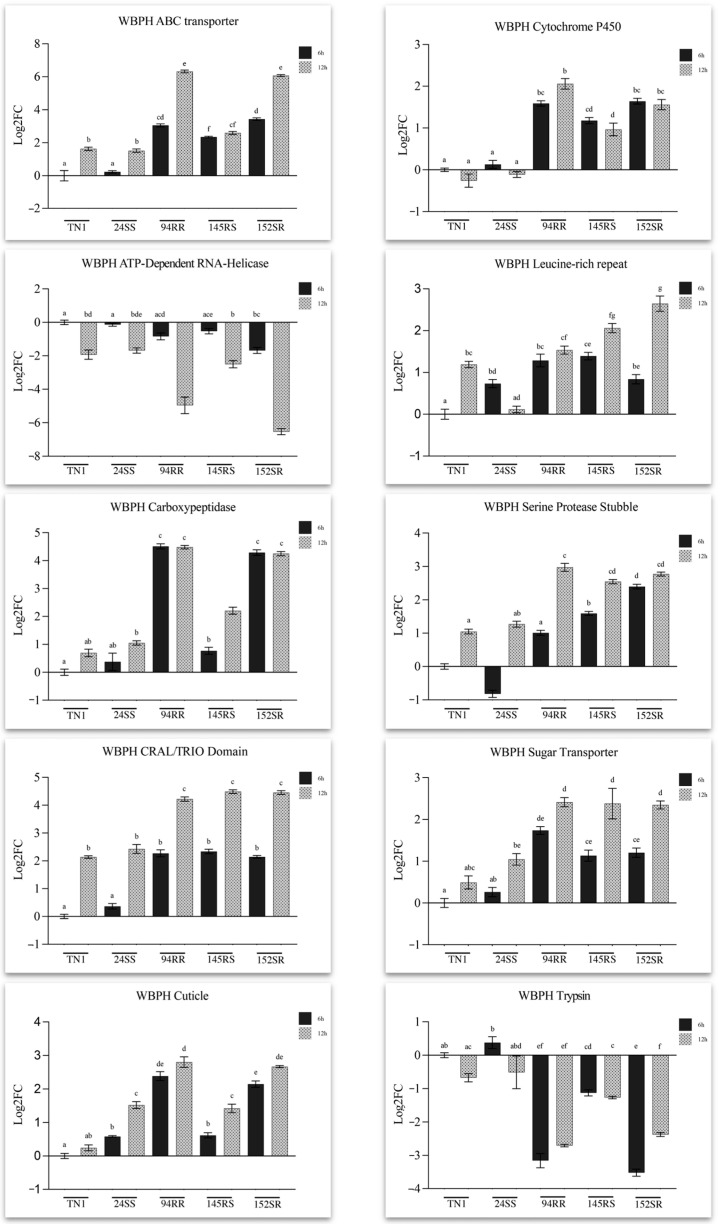
BPH (brown planthopper) and WBPH (white backed planthopper) are significant rice pests that often co-occur as sympatric species and cause substantial yield loss. Despite their genetic similarities, different host-resistance genes confer resistance against these two hoppers. The defense mechanisms in rice against these pests are complex, and the molecular processes regulating their responses remain largely unknown. This study used specific recombinant inbred lines (RILs) derived from a cross between rice varieties RP2068-18-3-5 (BPH- and WBPH-resistant) and TN1 (BPH- and WBPH-susceptible) to investigate the mechanisms of interaction between these planthoppers and their rice hosts. WBPH and BPH were allowed to feed on specific RILs, and RNA-Seq was carried out on WBPH insects. Transcriptome profiling and qRT-PCR results revealed differential expression of genes involved in detoxification, digestion, transportation, cuticle formation, splicing, and RNA processing. A higher expression of sugar transporters was observed in both hoppers feeding on rice with resistance against either hopper. This is the first comparative analysis of gene expressions in these insects fed on genetically similar hosts but with differential resistance to BPH and WBPH. These results complement our earlier findings on the differential gene expression of the same RILs (BPH- or WBPH-infested) utilized in this study. Moreover, identifying insect genes and pathways responsible for countering host defense would augment our understanding of BPH and WBPH interaction with their rice hosts and enable us to develop lasting strategies to control these significant pests.

Keywords: Nilaparvata lugens; Sogatella furcifera; gene expression analysis (GEA); integrated pest management (IPM); next-generation sequencing (NGS); recombinant inbred lines (RILs); rice pests; transcriptome.


Conflict of interest statement

The authors declare no conflict of interest. The funders had no role in the design of the study; in the collection, analyses, or interpretation of data; in the writing of the manuscript; or in the decision to publish the results.

Figures

Figure 1
Figure 1
Gene expression level analysis in WBPH. (A) FPKM (fragments per kilobase of exon per million mapped fragments) density distribution plot. The density distributions depict 21,254 transcripts as a measure of gene expression levels in each sample. (B) Violin plot indicating distributions of gene expression data of nine samples post normalization. The X-axis represents the three replicates of each sample, and the Y-axis indicates log2 (FPKM+1) values. (C) Pearson correlation coefficient matrix, depicting the correlation of the gene expression levels between samples and indicating the reliability of the experiments. (D) Principal Component Analysis (PCA) plot showing the variance of the three biological replicates of each of the three samples (W_TN1, W_TR145RS, W_TR152SR). The figures on each axis represent the percentages of variation explained by the principal components. (E) Co-expression Venn diagram indicating common and uniquely expressing genes in the three samples. The prefix ‘W_’ refers to WBPH samples.
Figure 2
Figure 2
Differential gene expression analysis of WBPH feeding on the different rice lines. (A) Volcano plot depicting the overall distribution of differentially expressed genes in the three groups W_TR145RS vs. W_TN1, W_TR152SR vs. W_TN1, and W_TR145RS vs. W_TR152SR. The horizontal axis denotes the fold change, while the vertical axis denotes the statistically significant differences in gene expression levels in the different groups. The squares represent genes; red and green squares indicate upregulated and downregulated genes, respectively, and blue squares indicate changes in gene expression levels that are statistically non-significant. (B) Hierarchical clustering heatmap depicting overall results of the FPKM clustering using log2 (FPKM+1) values. The red and blue squares indicate genes with high or low gene expression levels, respectively.
Figure 3
Figure 3
Gene Ontology enrichment analysis of the top 20 enriched GO terms in WBPH represented as dot plots. Differentially expressed genes were grouped into functional groups using ClusterProfiler (v3.8.1) software. The twenty most highly enriched GO terms, up- and down-regulated, are shown as bar plots. (A) GO enrichment analysis of Group1: W_TR145RS vs. W_TN1; (B) GO enrichment analysis of Group2: W_TR152SR vs. W_TN1; (C) GO enrichment analysis of Group3: W_TR152SR vs. W_TR145RS. Terms with a padj value < 0.05 were used as the standard for screening DEGs and were considered significantly enriched.
Figure 4
Figure 4
KEGG enrichment pathway analysis of the top 20 differentially expressed genes in WBPH represented as bar plots for the three groups, (A) W_TR145RS vs. W_TN1, (B) W_TR152SR vs. W_TN1, and (C) W_TR145RS vs. W_TR152SR. The differentially expressed genes were grouped into gene pathways using pathway enrichment analysis using the KEGG database and ClusterProfiler (v3.8.1) software.
Figure 5
Figure 5
Relative expression (Log2FC) analysis of the ten shortlisted genes of BPH (see Materials and Methods for details) fed on 5 rice genotypes: TN1, TR24SS, TR94RR, TR145RS, and TR152SR at two different time points (6 h and 12 h after release). Error bars represent mean ± SE (n = 3). Bars with different letters are statistically significant (p < 0.05).
Figure 6
Figure 6
Relative expression (Log2FC) analysis of the ten shortlisted genes of WBPH (see Materials and Methods for details) fed on 5 rice genotypes: TN1, TR24SS, TR94RR, TR145RS, and TR152SR at two different time points (6 h and 12 h after release). Error bars represent mean ± SE (n = 3). Bars with different letters are statistically significant (p < 0.05).

References

    1. Divya D., Sahu N., Reddy P.S., Nair S., Bentur J.S. RNA-Sequencing reveals differentially expressed rice genes functionally associated with defense against BPH and WBPH in RILS derived from a cross between RP2068 and TN1. Rice. 2021;14:27. doi: 10.1186/s12284-021-00470-3. - DOI - PMC - PubMed
    1. Mondal H. Shaping the understanding of saliva-derived effectors towards aphid colony proliferation in host plant. J. Plant Biol. 2017;60:103–115. doi: 10.1007/s12374-016-0465-x. - DOI
    1. Guo H., Zhang Y., Tong J., Ge P., Wang Q., Zhao Z., Zhu-Salzman K., Hogenhout S.A., Ge F., Sun Y. An aphid-secreted salivary protease activates plant defense in phloem. Curr. Biol. 2020;30:4826–4836. doi: 10.1016/j.cub.2020.09.020. - DOI - PubMed
    1. Jing S., Zhao Y., Du B., Chen R., Zhu L., He G. Genomics of interaction between the brown planthopper and rice. Curr. Opin. Insect Sci. 2017;19:82–87. doi: 10.1016/j.cois.2017.03.005. - DOI - PubMed
    1. Zheng X., Zhu L., He G. Genetic and molecular understanding of host rice resistance and Nilaparvata lugens adaptation. Curr. Opin. Insect Sci. 2021;45:14–20. doi: 10.1016/j.cois.2020.11.005. - DOI - PubMed

LinkOut - more resources