. 2023 Sep 14;24(18):14103.
doi: 10.3390/ijms241814103.

Hydroxychloroquine-Loaded Chitosan Nanoparticles Induce Anticancer Activity in A549 Lung Cancer Cells: Design, BSA Binding, Molecular Docking, Mechanistic, and Biological Evaluation

Affiliations

Hydroxychloroquine-Loaded Chitosan Nanoparticles Induce Anticancer Activity in A549 Lung Cancer Cells: Design, BSA Binding, Molecular Docking, Mechanistic, and Biological Evaluation

Fawzia I Elshami et al. Int J Mol Sci. .

Abstract

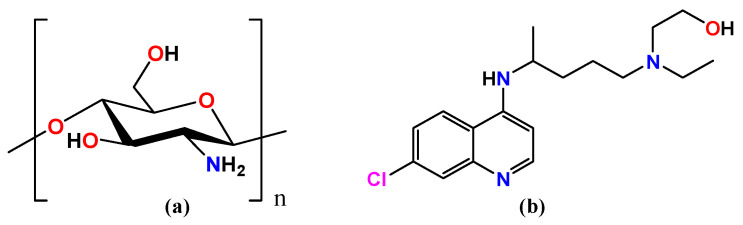
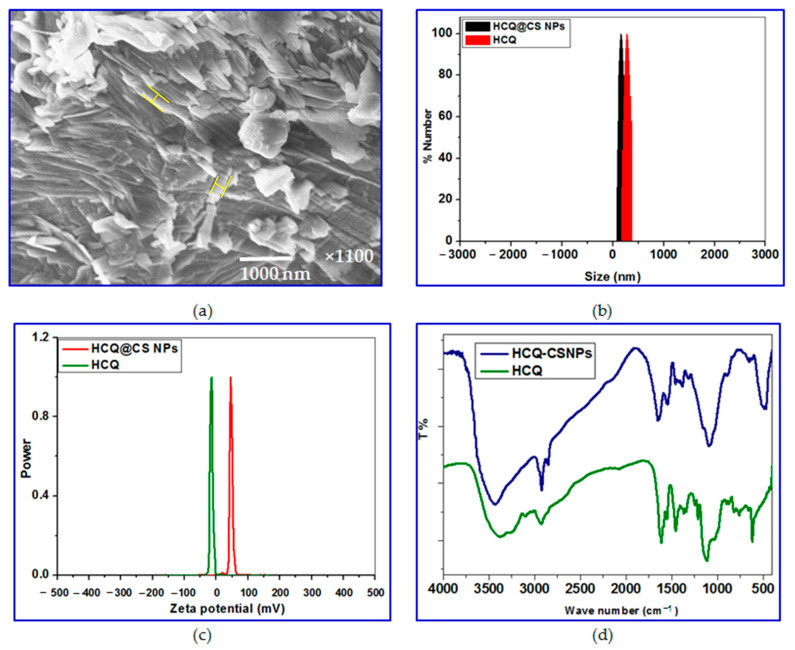
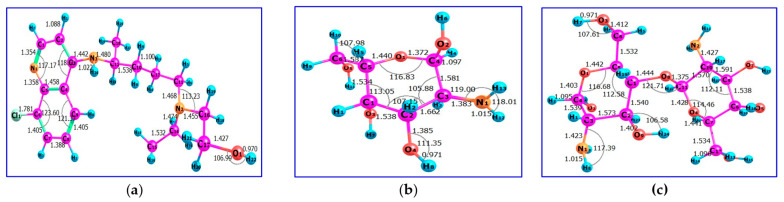
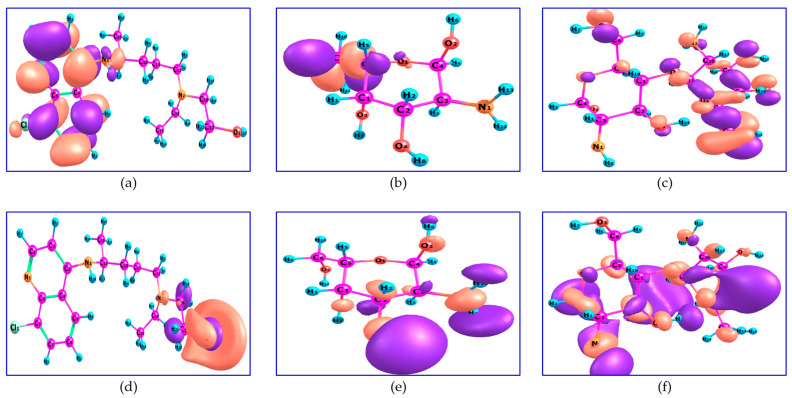
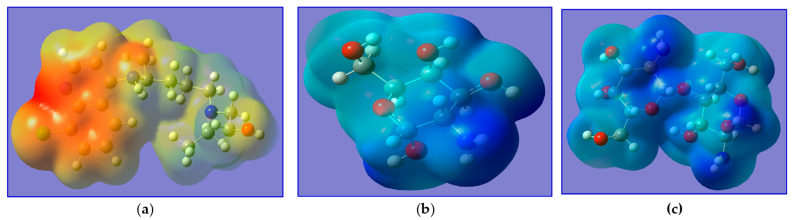
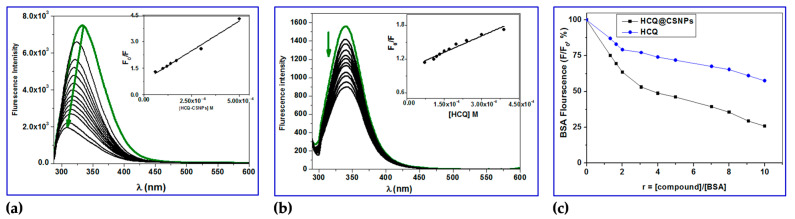
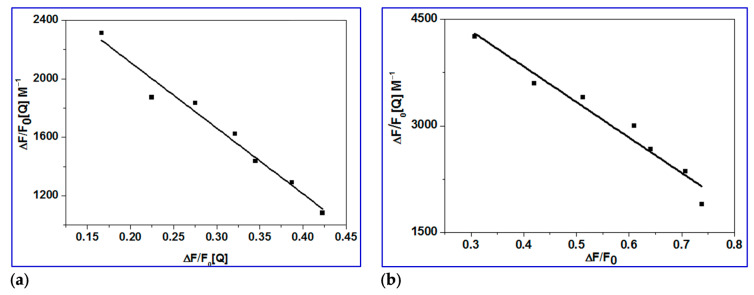
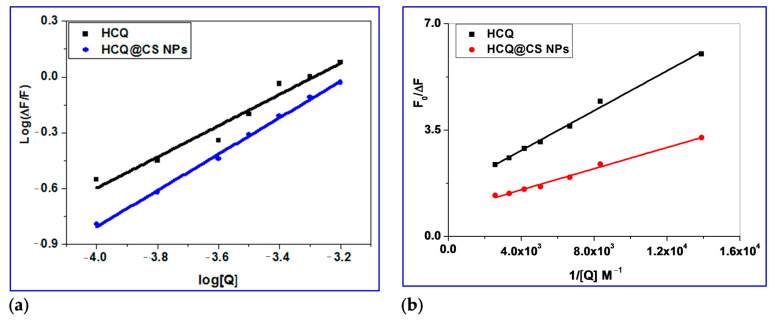
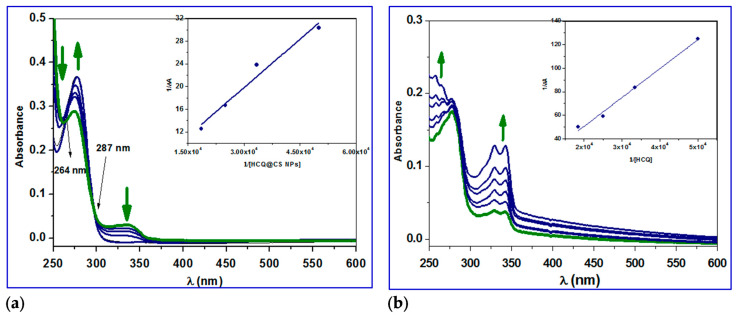
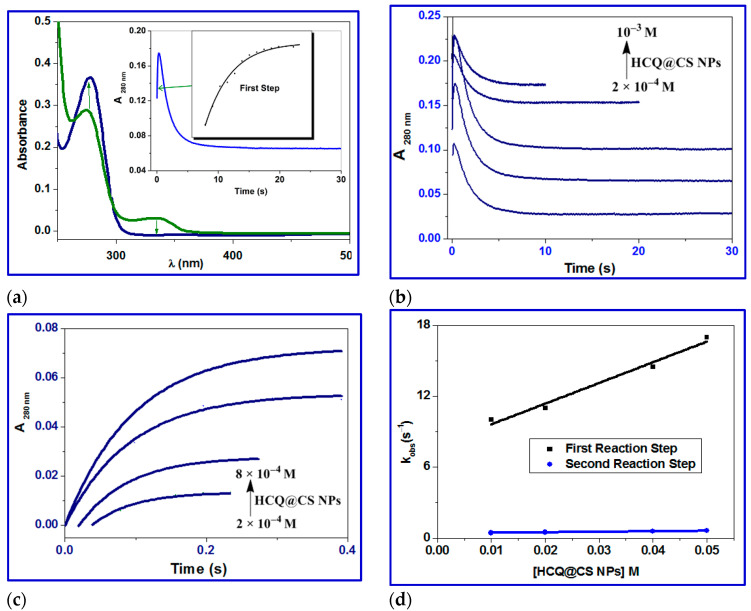
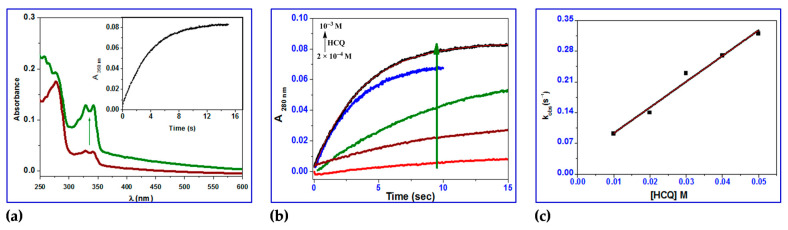
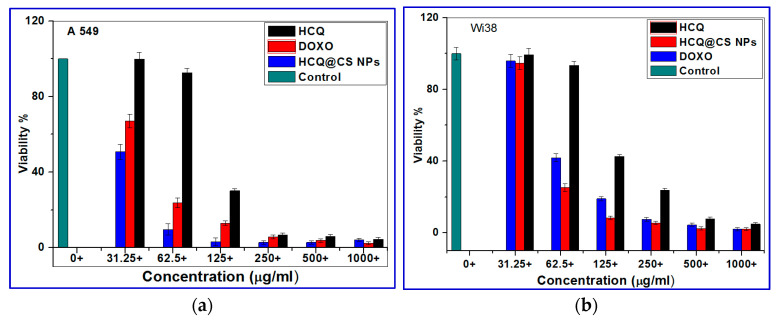
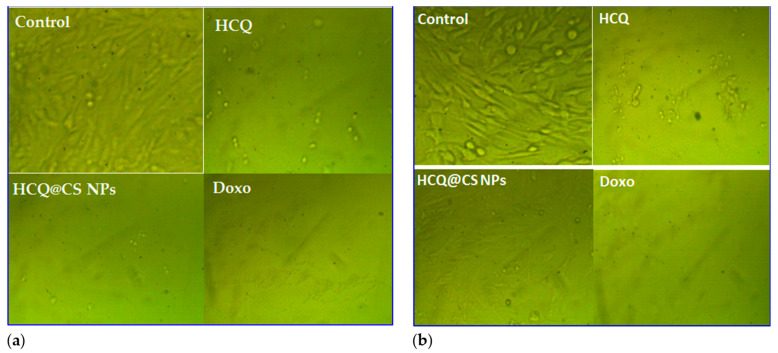
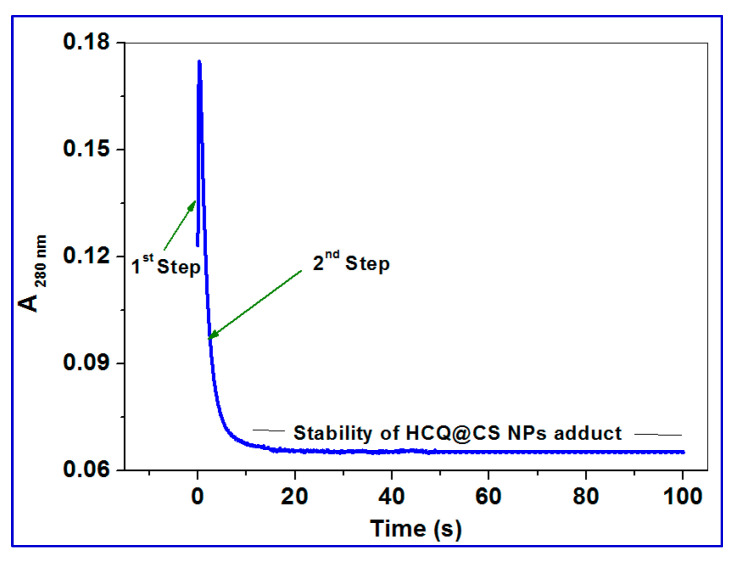
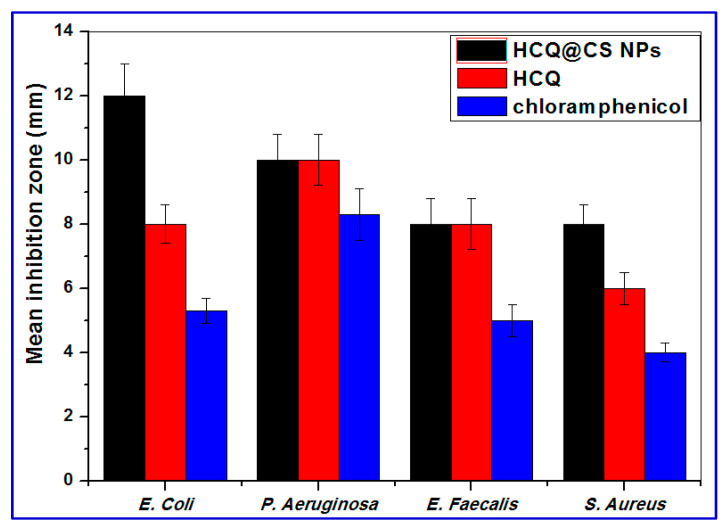
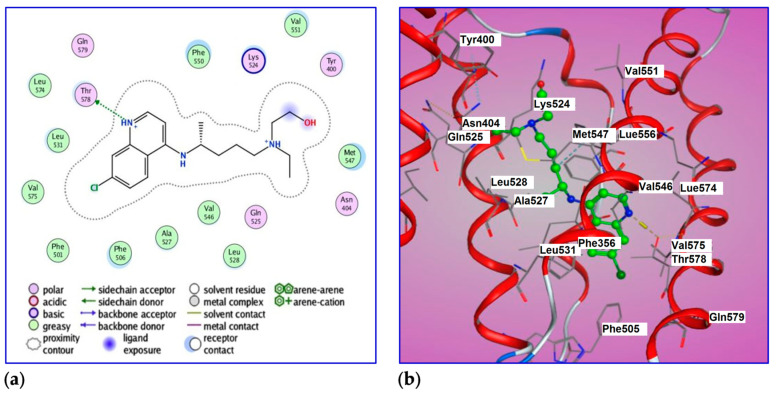
The current study describes the encapsulation of hydroxychloroquine, widely used in traditional medicine due to its diverse pharmacological and medicinal uses, in chitosan nanoparticles (CNPs). This work aims to combine the HCQ drug with CS NPs to generate a novel nanocomposite with improved characteristics and bioavailability. HCQ@CS NPs are roughly shaped like roadways and have a smooth surface with an average size of 159.3 ± 7.1 nm, a PDI of 0.224 ± 0.101, and a zeta potential of +46.6 ± 0.8 mV. To aid in the development of pharmaceutical systems for use in cancer therapy, the binding mechanism and affinity of the interaction between HCQ and HCQ@CS NPs and BSA were examined using stopped-flow and other spectroscopic approaches, supplemented by molecular docking analysis. HCQ and HCQ@CS NPs binding with BSA is driven by a ground-state complex formation that may be accompanied by a non-radiative energy transfer process, and binding constants indicate that HCQ@CS NPs-BSA was more stable than HCQ-BSA. The stopped-flow analysis demonstrated that, in addition to increasing BSA affinity, the nanoformulation HCQ@CS NPS changes the binding process and may open new routes for interaction. Docking experiments verified the development of the HCQ-BSA complex, with HCQ binding to site I on the BSA structure, primarily with the amino acids, Thr 578, Gln 579, Gln 525, Tyr 400, and Asn 404. Furthermore, the nanoformulation HCQ@CS NPS not only increased cytotoxicity against the A549 lung cancer cell line (IC50 = 28.57 ± 1.72 μg/mL) compared to HCQ (102.21 ± 0.67 μg/mL), but also exhibited higher antibacterial activity against both Gram-positive and Gram-negative bacteria when compared to HCQ and chloramphenicol, which is in agreement with the binding constants. The nanoformulation developed in this study may offer a viable therapy option for A549 lung cancer.

Keywords: A549 lung cancer; antibacterial; cell penetration; dissociation constants; drug affinity; hydroxychloroquine; molecular docking; nanoparticles.


Conflict of interest statement

The authors declare no conflict of interest.

Figures

Figure 1
Figure 1
Structural formula of (a) chitosan, and (b) hydroxychloroquine.
Figure 2
Figure 2
(a) SEM images of HCQ@CS NPs under 500 nm field of view; shape-like roads are highlighted; (b) the particle size distribution of HCQ and HCQ@CS NPs detected by Zetasizer Nano ZS; (c) zeta potential of HCQ, and HCQ@CS NPs; (d) the chemical structure of HCQ, and HCQ@CS NPs are analyzed by FT-IR.
Figure 3
Figure 3
The optimized geometries of (a) HCQ, (b) M and (c) MM.
Figure 4
Figure 4
HOMO of (a) HCQ; (b) M and (c) MM and LUMO of (d) HCQ; (e) M and (f) MM.
Figure 5
Figure 5
MEP of (a) HCQ, (b) M, and (c) MM.
Figure 6
Figure 6
Fluorescence quenching spectra of BSA in the absence (green) and presence (black) of various concentration of (a) HCQ@CSNPs and (b) HCQ at T = 298 K, λexc = 278 nm, λem = 343 nm, pH = 7.2 and [BSA] = 4 × 10⁻⁴ M; green arrows show the quenching; insets show Stern–Volmer plots; (c) Plot of relative BSA fluorescence intensity at λem = 343 nm (F/F0, %) vs. r (r = [compound]/[BSA]) for HCQ@CSNPs and HCQ at T = 298 K, λexc = 278 nm, λem = 343 nm, pH = 7.2 and [BSA] = 4 × 10⁻⁴ M. Arrows showed the quenching with or without wavelength shift.
Figure 7
Figure 7
Scatchard plots of the reaction of BSA with (a) HCQ and (b) HCQ@CSNPs.
Figure 8
Figure 8
(a) Double logarithmic plot of BSA (0.4 mM) fluorescence quenching in presence HCQ@CSNPs and HCQ at different concentrations; (b) Modified Stern–Volmer plot; the accessibility of BSA to HCQ@CSNPs and HCQ.
Figure 9
Figure 9
UV–vis spectral changes of the reaction of BSA in the absence (green line) and presence (blue lines) of different concentrations of (a) HCQ@CS NPs and (b) HCQ in methanol at 296 K. Arrows showed the hypochromic and hyperchromic effects.
Figure 10
Figure 10
(a) UV–vis spectral changes of binding of BSA in the absence (green line) and presence (blue line) of HCQ@CS NPs; green arrows show the hyperchromism and hypochromism; inset showing the kinetic trace at 280 nm containing two reaction steps; (b) kinetic traces of different concentrations of HCQ@CS NPs (2 × 10⁻⁴, 4 × 10⁻⁴, 6 × 10⁻⁴, 8 × 10⁻⁴, 10−3 M) with BSA; (c) fast step of the reaction of different concentrations of HCQ@CS NPs (2 × 10⁻⁴, 4 × 10⁻⁴, 6 × 10⁻⁴, 8 × 10⁻⁴ M) with BSA; (d) plots of kobs versus concentration of the first and second reaction steps of BSA with HCQ@CSNPs in methanol at 296 K.
Figure 11
Figure 11
(a) UV–vis spectral changes of binding of BSA in the absence (brown line) and presence (green line) of HCQ; inset showing the kinetic trace at 280 nm containing two reaction steps; (b) kinetic traces of different concentrations of HCQ (2 × 10⁻⁴, 4 × 10⁻⁴, 6 × 10⁻⁴, 8 × 10⁻⁴, 10−3 M) with BSA; (c) plots of kobs versus concentration of the first and second reaction steps of BSA with HCQ in methanol at 296 K.
Figure 12
Figure 12
Cell viability results from the MTT assay for (a) A549 cancer cells and (b) Wi38 normal cells with HCQ, HCQ@CS NPs and Doxo for 24 h.
Figure 13
Figure 13
Morphological changes in (a) Wi38 normal cells and (b) A549 cancer cells following 24 h of treatment with control, HCQ, HCQ@CS NPs, and Doxo at 1000 μg/mL concentrations. Scale bar: 25 μm.
Figure 14
Figure 14
Kinetic trace of showing the stability of HCQ@CS NPs–BSA adduct over longer time.
Figure 15
Figure 15
Mean inhibition zone of the HCQ free drug and its loaded nanoparticles against Gram-negative (E. coli and P. aeruginosa) and Gram-positive (S. aureus and E. faecalis) bacteria.
Figure 16
Figure 16
(a) Two-dimensional (2D) and (b) 3D diagrams of ligand showing its interaction with crystal structure of BSA (4F5S) binding site.

Similar articles

Cited by

References

    1. Sung H., Ferlay J., Siegel R.L., Laversanne M., Soerjomataram I., Jemal A., Bray F. Global Cancer Statistics 2020: GLOBOCAN Estimates of Incidence and Mortality Worldwide for 36 Cancers in 185 Countries. CA Cancer J. Clin. 2021;71:209–249. doi: 10.3322/caac.21660. - DOI - PubMed
    1. Casaluce F., Sgambato A., Maione P. The potential role of new targeted therapies in the treatment of advanced non-small-cell lung cancer. Clin. Investig. 2013;3:369–383. doi: 10.4155/cli.13.14. - DOI
    1. Ahmad S. Platinum–DNA interactions and subsequent cellular processes controlling sensitivity to anticancer platinum complexes. Chem. Biodivers. 2010;7:543–566. doi: 10.1002/cbdv.200800340. - DOI - PubMed
    1. Sterlacci W., Fiegl M., Tzankov A. Prognostic and predictive value of cell cycle deregulation in non-small-cell lung cancer. Pathobiology. 2012;79:175–194. doi: 10.1159/000336462. - DOI - PubMed
    1. Negrini S., Gorgoulis V.G., Halazonetis T.D. Genomic instability—An evolving hallmark of cancer. Nat. Rev. Mol. Cell Biol. 2010;11:220–228. doi: 10.1038/nrm2858. - DOI - PubMed