. 2023 Sep 14;24(18):14107.
doi: 10.3390/ijms241814107.

miR-29a Is Downregulated in Progenies Derived from Chronically Stressed Males

Affiliations

miR-29a Is Downregulated in Progenies Derived from Chronically Stressed Males

Marta F Riesco et al. Int J Mol Sci. .

Abstract

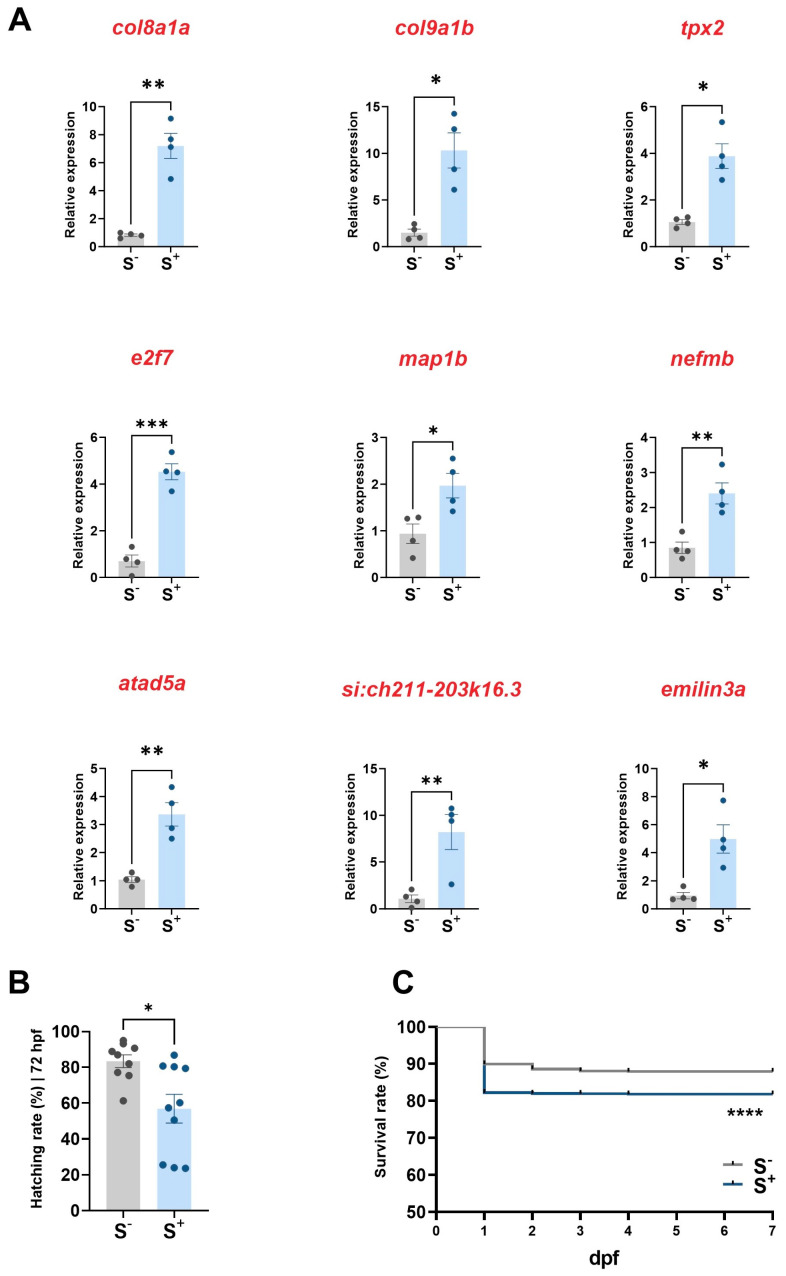
Recent research has provided compelling evidence demonstrating that paternal exposure to different stressors can influence their offspring's phenotypes. We hypothesized that paternal stress can negatively impact the progeny, altering different miRs and triggering different physiological alterations that could compromise offspring development. To investigate this, we exposed zebrafish male siblings to a chronic stress protocol for 21 days. We performed RNA-sequencing (RNA-seq) analyses to identify differentially expressed small noncoding RNAs in 7-day postfertilization (dpf) larvae derived from paternally stressed males crossed with control females compared with the control progeny. We found a single miRNA differentially expressed-miR-29a-which was validated in larva and was also tested in the sperm, testicles, and brain of the stressed progenitors. We observed a vertical transmission of chronic stress to the unexposed larvae, reporting novel consequences of paternally inherited chronic stress at a molecular level. The deregulation of mi-R29a in those larvae could affect relevant biological processes affecting development, morphogenesis, or neurogenesis, among others. Additionally, these disruptions were associated with reduced rates of survival and hatching in the affected offspring.

Keywords: RNA-seq; behavior; chronic stress; hatching rates; malformations; offspring; small-RNAs; survival.


Conflict of interest statement

The authors declare no conflict of interest.

Figures

Figure A1
Figure A1
Behavioral studies in adult zebrafish by Novel Test Tank (NTT) Noldus Ethovision® software, XT16 version (1 min acclimatization + 5 min evaluation). (A) Kinetic parameters: velocity (cm/s) and swum distance (cm). (B) Total time spent by fish in the upper, middle, and lower zones (s) and percentage of time (%) in each zone at different minutes. (C) Latency to the first entry in the upper zone. Note that individuals not reaching the upper zone are shown with black dots in the figure. (D) Percentage of fish (colored dots) spending less than 30 s (10% of the total NTT) in the upper zone during the behavior assay in each experimental group. S: adult fish resulting from crossings involving control progenitors. S+: adult zebrafish from crossings involving control females and chronically stressed males. Data are presented as mean ± SEM.
Figure 1
Figure 1
Experimental design. Zebrafish male siblings were exposed to a chronic stress (CS) protocol for 21 days. The three stages of the experiment are Stage 1, aimed to find differentially expressed noncoding RNAs in 7-day postfertilization (dpf) larvae derived from paternally chronically stressed males crossed with control females compared with control progenies; Stage 2, focused on evaluating the expression of the selected ncRNA on different paternal tissues (sperm, testicles, and brain); Stage 3, larvae behavioral and developmental analyses.
Figure 2
Figure 2
RNA-seq analyses focused on small RNAs populations in S and S+ 7 dpf larvae revealed (A) miR-29a as the unique differentially expressed small RNA. (B) validation of miR-29a downregulation with qPCR experiments. (C) miR-29a levels in the testicles (n = 8) and spermatozoa (n = 4 pools) samples from the chronically stressed male progenitors. Top entries reported by g:Profiler analysis of the miR-29a targets included in the TargetFishScan database for (D) molecular function, (E) cellular component, (F) biological pathways (Reactome database), and (G) biological processes. S: larvae resulting from crossings involving control progenitors. S+: larvae from crossings involving control females and chronically stressed males. Data in (B,C) are presented as mean ± SEM (* p < 0.0500; ns: not statistically significant differences).
Figure 3
Figure 3
(A) relative gene expression (normalized with actb2) of nine targets of miR-29a in 7 dpf larvae (n = 4). (B) hatching rate at 72 h postfertilization (hpf; n = 9–10). (C) Kaplan–Meier survival curves (1–7 dpf) for the two experimental groups. S: larvae resulting from crossings involving control progenitors. S+: larvae from crossings involving control females and chronically stressed males. Data are presented as mean ± SEM (* p < 0.0500; ** p < 0.0100; *** p < 0.0010; and **** p < 0.00010).
Figure 4
Figure 4
Brain and behavioral analyses. (A) relative miR-29a expression in paternal brains (n = 9). (B) diagram representing the novel tank test (NTT) used in the experiment. Example of a track reported by Tracker software 6.0.8 version (red line). Virtual grid (16 zones) used for movement quantification in terms of zone exploration. (C) evaluated tracks from both groups. (D) histograms showing scored areas in both groups studying the total areas (all), perimetral zones (outer), and central zones (inner). (E) mean values for the scoring areas for the biological replicates (n = 3). (F) diagram showing the three measurements evaluated in the cranioencephalic region of the larvae: (1) Meckel’s-palatoquadrate (M–PQ) angle, (2) ceratohyal cartilage length, and (3) lower jaw length. (G) comparisons for M–PQ angle, ceratohyal cartilage length (mm), lower jaw length (mm). S: larvae resulting from crossings involving control progenitors. S+: larvae from crossings involving control females and chronically stressed males. Data are presented as mean ± SEM (ns: not statistically significant differences).

Similar articles

Cited by

References

    1. Schreck C.B., Tort L. The Concept of Stress in Fish. Fish Physiol. 2016;35:1–34. doi: 10.1016/B978-0-12-802728-8.00001-1. - DOI
    1. Chrousos G.P. Stress and Disorders of the Stress System. Nat. Rev. Endocrinol. 2009;5:374–381. doi: 10.1038/nrendo.2009.106. - DOI - PubMed
    1. Barton B.A. Stress in Fishes: A Diversity of Responses with Particular Reference to Changes in Circulating Corticosteroids. Integr. Comp. Biol. 2002;42:517–525. doi: 10.1093/icb/42.3.517. - DOI - PubMed
    1. Ilacqua A., Izzo G., Emerenziani G.P., Baldari C., Aversa A. Lifestyle and Fertility: The Influence of Stress and Quality of Life on Male Fertility. Reprod. Biol. Endocrinol. 2018;16:115. doi: 10.1186/s12958-018-0436-9. - DOI - PMC - PubMed
    1. Rooney K.L., Domar A.D. The Relationship between Stress and Infertility. Dialog. Clin. Neurosci. 2018;20:41–47. doi: 10.31887/DCNS.2018.20.1/klrooney. - DOI - PMC - PubMed