. 2023 Sep 21;24(18):14381.
doi: 10.3390/ijms241814381.

A Side-by-Side Comparison of Wildtype and Variant Melanocortin 1 Receptor Signaling with Emphasis on Protection against Oxidative Damage to DNA

Affiliations

A Side-by-Side Comparison of Wildtype and Variant Melanocortin 1 Receptor Signaling with Emphasis on Protection against Oxidative Damage to DNA

Sonia Cerdido et al. Int J Mol Sci. .

Abstract

Common variants of the MC1R gene coding the α-melanocyte stimulating hormone receptor are associated with light skin, poor tanning, blond or red hair, and increased melanoma risk, due to pigment-dependent and -independent effects. This complex phenotype is usually attributed to impaired activation of cAMP signaling. However, several MC1R variants show significant residual coupling to cAMP and efficiently activate mitogenic extracellular signal-regulated kinase 1 and 2 (ERK1/2) signaling. Yet, residual signaling and the key actions of wildtype and variant MC1R have never been assessed under strictly comparable conditions in melanocytic cells of identical genetic background. We devised a strategy based on CRISPR-Cas9 knockout of endogenous MC1R in a human melanoma cell line wildtype for BRAF, NRAS and NF1, followed by reconstitution with epitope-labeled MC1R constructs, and functional analysis of clones expressing comparable levels of wildtype, R151C or D294H MC1R. The proliferation rate, shape, adhesion, motility and sensitivity to oxidative DNA damage were compared. The R151C and D294H RHC variants displayed impaired cAMP signaling, intracellular stability similar to the wildtype, triggered ERK1/2 activation as effectively as the wildtype, and afforded partial protection against oxidative DNA damage, although less efficiently than the wildtype. Therefore, common melanoma-associated MC1R variants display biased signaling and significant genoprotective activity.

Keywords: DNA damage; cAMP; extracellular signal-regulated kinases 1 and 2 (ERK1/2); melanocortin 1 receptor (MC1R); melanoma; proliferation; signaling; variant MC1R.


Conflict of interest statement

The authors declare no conflict of interest.

Figures

Figure 1
Figure 1
Stable expression of WT and variant MC1R in melanoma cells of identical genetic background. (A) Strategy for the generation of HBL human melanoma cell-derived clones expressing a single and defined variant of the MC1R. See text and Supplementary Figure S1 for details. (B) Expression and intracellular stability of the WT, R151C and D294H forms of MC1R. Cells were treated with 0.1 mM cycloheximide for the indicated times, detergent-solubilized, electrophoresed, and analyzed for MC1R with anti-flag. (C) Steady-state level of expression of WT and variant MC1R. Detergent-solubilized cell extracts were analyzed for MC1R expression via Western blot. The intensity of the MC1R band was corrected for protein loading using β-actin (ACTB) as the loading control. Results are normalized to the expression of WT MC1R and are the mean ± sem for 7 independent experiments. (D) Semi-logarithmic plots for the estimation of the rate of decay of WT or variant MC1R in live HBL cells. The intracellular half-lives of the different receptor forms, estimated from the slopes of the adjusted linear plots, are indicated (mean ± sem, n ≥ 3). (E) Confocal micrographs of HBL cells expressing defined MC1R variants. MC1R was immunostained with anti-FLAG, with or without a 15 min treatment with 0.4% Triton X-100 in PBS for permeabilization of the cell membrane. The graphs on the right show the MC1R staining intensity normalized to the cells expressing the WT receptor. **, p < 0.01; ***, p < 0.001; ****, p < 0.0001. Scale bar 50 µm.
Figure 2
Figure 2
Functional coupling of WT and variant MC1R. Cells expressing the indicated MC1R variants were stimulated with 100 nM NDP-MSH for the times shown and analyzed for (A) intracellular cAMP and (B) ERK activation. The upper Western blots are representative of three independent experiments, and the lower bar graphs represent the quantification of the active ERK intensity, normalized to the non-stimulated control (0 min timepoint, mean ± sem, n = 3). (C) Steady-state levels of MITF in unstimulated cells expressing the indicated MC1R forms. The image is representative of five independent Western blots, whose quantification is shown below as a bar graph (values normalized to the MC1R-KO expression, results given as mean ± sem, n = 5). (D) Changes in MITF expression upon stimulation of cells expressing the indicated MC1R form with 100 nM NDP-MSH for 48 h. Representative blots are shown at the top, and the fold change in band intensity, normalized to each non-stimulated control, is shown below (mean ± sem, n = 3).
Figure 3
Figure 3
MC1R activation modulates proliferation and cell cycle progression. (A) Growth curves of MC1R clones cultured in 2D and complete medium (DMEM + 10% FCS) determined by manual cell counting. Equal numbers of cells were seeded, cells were allowed to attach for 24 h (time 0) and counted every 24 h. Growth was represented as fold increase in cell number relative to the initial number in the 0-time point. The statistical significance of the cell numbers in MC1R-expressing cells compared with MC1R-KO cells at 72 h is shown. (B) FACS analysis of MC1R clones cultured in total medium (DMEM + 10% FCS) for three days. Results are given as mean ± sd (n = 5). Stars indicate the statistical significance of each phase compared with the same phase in MC1R-KO cells. (C) FACS analysis of MC1R clones cultured under FCS-starved conditions (DMEM and no FCS) for two days in the presence or absence of 100 nM NDP-MSH. For each receptor form, the stars within the bars of the NDP-MSH condition indicate the statistical significance of each phase compared with the same phase in the corresponding untreated control (results given as mean ± sd, n ≥ 3; ns, not significant). *, p < 0.05; **, p < 0.01; ***, p < 0.001.
Figure 4
Figure 4
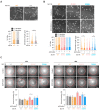
Effect of the MC1R genotype on cell shape and motility. (A) Effect of WT MC1R on shape and dendricity. MC1R-KO cells or cells expressing WT MC1R were grown in complete medium with 10% FCS. Micrographs were taken using an Eclipse TS2 microscope with 20x objective lenses, scale bar 50 µm. A quantitative analysis of the number and length of dendrites per cell in randomly selected images is shown below the micrographs (at least 100 cells per condition were analyzed, and the results are given as median ± SEM for length or mean ± SEM for number, n = 3). (B) Effect of NDP-MSH on shape of cells expressing WT or variant MC1R. When required, cells were treated for 48 h with 100 nM NDP-MSH before acquisition and analysis of the micrographs (100 cells quantified per condition; the scale bar and results are formatted as in (A)). (C) Basal and MC1R-agonist induced migration of cells expressing the different MC1R forms. Cells were seeded on Oris™ 96-well plates with silicon stoppers in serum-reduced medium, and if required were treated with 100 nM NDP-MSH for 24 h. The stoppers were removed, and images were taken at 24 h or 48 h after removal of the stoppers. Representative images are shown, along with the quantification of wound healing at 24 h or 48 h (results are given as mean ± SEM, n = 3). *, p < 0.05; **, p < 0.01; ****, p < 0.0001.
Figure 5
Figure 5
Genoprotective action against oxidative stress of the different MC1R forms. (A) γH2AX immunostaining of control cells and cells challenged with Luperox (150 µM, 30 min) with or without a previous treatment with NDP-MSH (100 nM, 48 h). The confocal images correspond to one of two independent experiments with comparable results. Scale bar 50 µm. For each experiment, at least 100 cells were randomly selected and analyzed for staining intensity. The plots below show the median of the staining intensity of cells, normalized to the control condition (no treatment with NDP-MSH or Luperox). (B) Neutral comet assay. In this case, cells pretreated or not with NDP-MSH were challenged with 100 µM Luperox for 20 min. Two independent experiments were performed with consistent results. *, p < 0.05; **, p < 0.01; ***, p < 0.001; ****, p < 0.0001. Scale bar 25 µm.

References

    1. Rees J.L. Genetics of Hair and Skin Color. Annu. Rev. Genet. 2003;37:67–90. doi: 10.1146/annurev.genet.37.110801.143233. - DOI - PubMed
    1. Garcia-Borron J.C., Abdel-Malek Z., Jimenez-Cervantes C. MC1R, the CAMP Pathway, and the Response to Solar UV: Extending the Horizon beyond Pigmentation. Pigment Cell Melanoma Res. 2014;27:699–720. doi: 10.1111/pcmr.12257. - DOI - PMC - PubMed
    1. Wolf Horrell E.M., Boulanger M.C., D’Orazio J.A. Melanocortin 1 Receptor: Structure, Function, and Regulation. Front. Genet. 2016;7:95. doi: 10.3389/fgene.2016.00095. - DOI - PMC - PubMed
    1. Manganelli M., Guida S., Ferretta A., Pellacani G., Porcelli L., Azzariti A., Guida G. Behind the Scene: Exploiting MC1R in Skin Cancer Risk and Prevention. Genes. 2021;12:1093. doi: 10.3390/genes12071093. - DOI - PMC - PubMed
    1. Tagliabue E., Gandini S., Bellocco R., Maisonneuve P., Newton-Bishop J., Polsky D., Lazovich D., Kanetsky P.A., Ghiorzo P., Gruis N.A., et al. MC1R Variants as Melanoma Risk Factors Independent of At-Risk Phenotypic Characteristics: A Pooled Analysis from the M-SKIP Project. Cancer Manag. Res. 2018;10:1143–1154. doi: 10.2147/CMAR.S155283. - DOI - PMC - PubMed