. 2023 Aug 28;13(9):1817.
doi: 10.3390/life13091817.

Total and Extracellular Vesicle cAMP Contents in Urine Are Associated with Autosomal Dominant Polycystic Kidney Disease (ADPKD) Progression

Affiliations

Total and Extracellular Vesicle cAMP Contents in Urine Are Associated with Autosomal Dominant Polycystic Kidney Disease (ADPKD) Progression

María Lucía Rosenberg et al. Life (Basel). .

Abstract

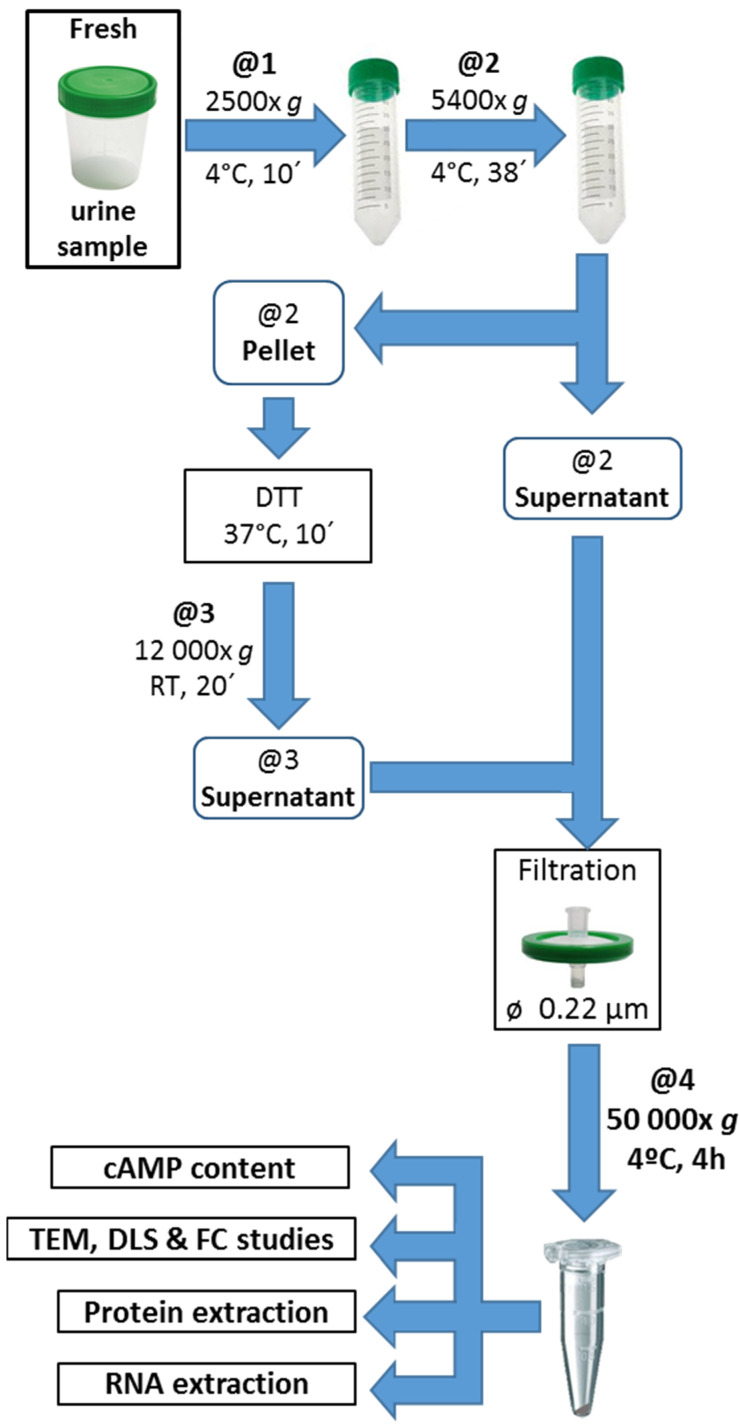
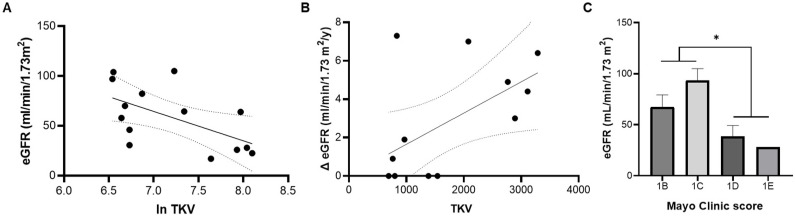
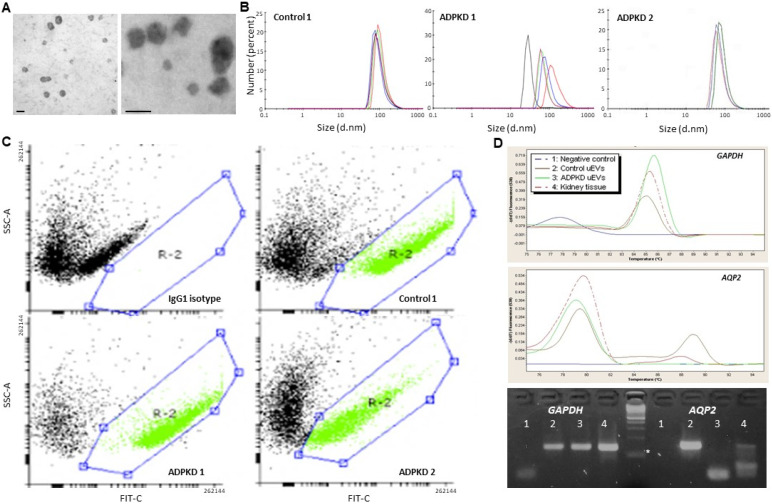
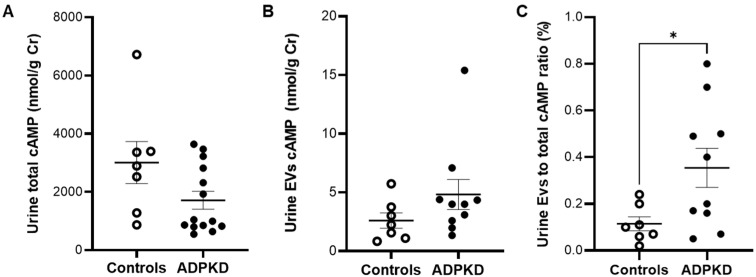
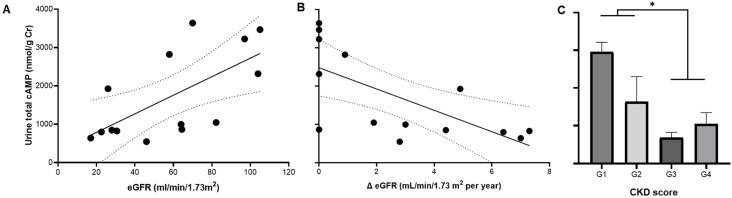
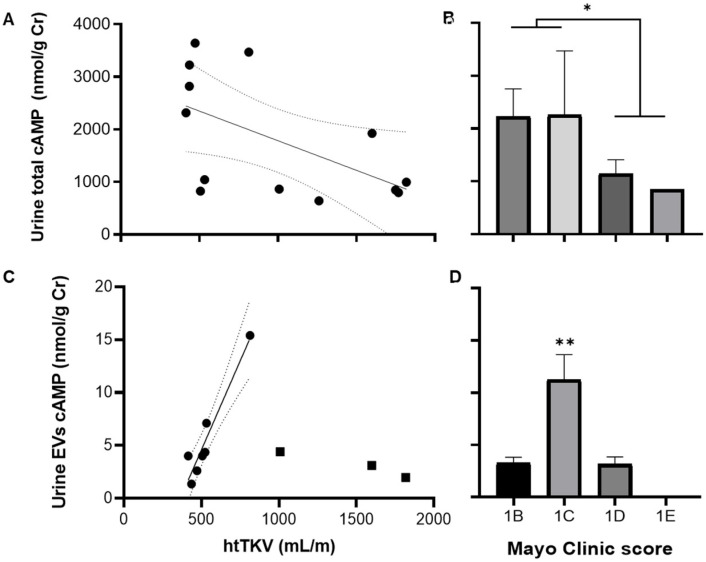
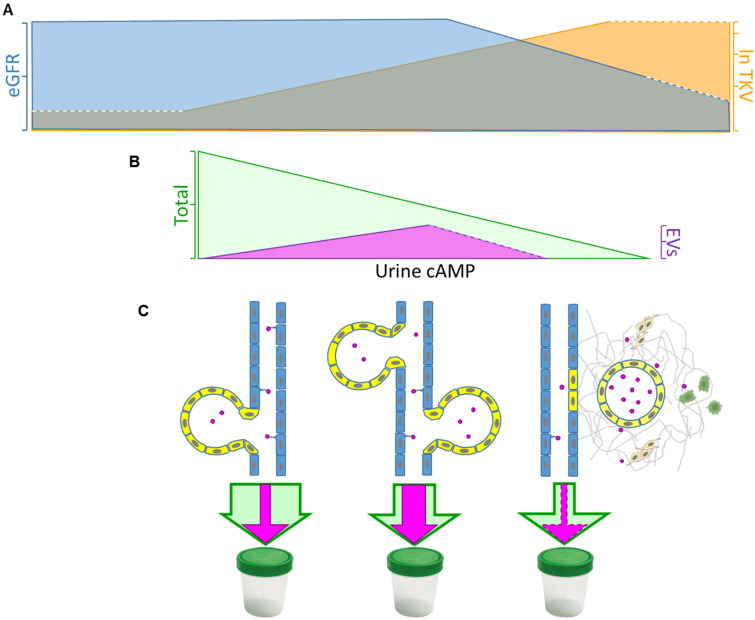
ADPKD is the most common genetic renal disease, characterized by the presence of multiple cysts which, through slow and gradual growth, lead to glomerular filtration rate (GFR) decline and end-stage renal disease. Cystic growth is associated with increased intracellular levels of 3',5'-cyclic adenosine monophosphate (cAMP). Extracellular vesicles (EVs) are proposed to participate in "remote sensing" by transporting different cargoes, but their relevance to ADPKD progression is poorly understood. This study aimed to determine whether cAMP is contained in urinary EVs and, if so, how total and/or EV cAMP contents participate in disease progression. Fourteen ADPKD patients, naïve for V2 receptor antagonism treatment, and seven controls were studied. Progression was evaluated by estimating GFR (eGFR) and height-adjusted total kidney volume (htTKV). Fresh morning urine was collected to determine cAMP by the competitive radioligand assay. Urine EVs were isolated using an adapted centrifugation method and characterized by electron microscopy, dynamic light scanning, flow cytometry with FITC CD63 labeling, protein and RNA content, and AQP2 and GAPDH mRNA detection. Total and EV cAMP was measurable in both control and patient urine samples. Total cAMP was significantly correlated with eGFR and its annual change but inversely correlated with htTKV. The cAMP-EVs showed a bimodal pattern with htTKV, increasing to ~1 L/m and falling at larger sizes. Our results demonstrate that urine cAMP correlates with ADPKD progression markers, and that its extracellular delivery by EVs could reflect the architectural disturbances of the organ.

Keywords: ADPKD progression; cyclic AMP; cystic growth; urine extracellular vesicles.


Conflict of interest statement

The authors declare no conflict of interest. The funders had no role in the design of the study, the collection, analyses, or interpretation of data, the writing of the manuscript, or the decision to publish the results.

Figures

Figure 1
Figure 1
Isolation of urinary extracellular vesicles (EVs) using the adapted centrifugation method. First-morning-void urine samples were collected in sterile recipients. A 50 mL aliquot was pretreated by centrifugation (@1) to pull down cell fragments and apoptotic cells, the pellet was discarded, and the supernatant was centrifuged again (@2). The resulting pellet was incubated with 200 mg/mL dithiothreitol (DTT) and centrifuged (@3); then, the supernatants from @2 and @3 were combined. After a cleaning step with a 0.22 µm syringe filter, the pretreated urine was then centrifuged by equalizing time and speed (@4) to the traditional ultracentrifugation method. Finally, the pellet was reconstituted with PBS for cAMP and morphometric determination [transmission electron microscopy (TEM), dynamic light scanning (DLS)], and flow cytometry (FC) analyses, or lysis buffers for protein and RNA extraction. RT: room temperature.
Figure 2
Figure 2
Association between mean clinical parameters of ADPKD progression. Total kidney volume (TKV) correlates with absolute (A) and annual change (Δ) in estimated GFR (eGFR) (B), and eGFR declines as the Mayo Clinic image score progresses from 1B to 1E (C). Regression parameters for (A): R = 0.58, p = 0.029, TKV (mL, transformed as ln) vs. eGFR; for (B): R = 0.57, p = 0.043 Δ eGFR vs. TKV. * Mayo Clinic scores 1B and 1C vs. 1D and 1E; p = 0.019 by unpaired t-test.
Figure 3
Figure 3
Particles obtained by an adapted centrifugation method from control and ADPKD urine samples are characterized as urinary extracellular vesicles (EVs). Morphometric and size determination by electron microscopy (A) and dynamic light scanning (B); flow cytometry for CD63 (C); GAPDH and AQP2 mRNA detection (D). The lipid-bilayer spheroids ranged from 30 to 150 nm in diameter (A,B), and showed a CD63 FITC-positive signal (green) in an area (R-2) different from the IgG1 isotype in two ADPKD samples and one control sample (C). Real-time PCR products from control (n = 2) and ADPKD (n = 2) pooled urine EV samples showed 85.4 and 89.5 °C melting peaks for GADPH (D, upper panel) and AQP2 (D, middle panel), respectively. Additionally, representative 4% agarose gel electrophoresis (D, lower panel) showed 137 and 146 bp bands for GAPDH and AQP2 PCR products, respectively. * Denotes the 100 bp band of molecular weight marker. Scale bars: 100 nm.
Figure 4
Figure 4
Total (A) and extracellular vesicles (EV) (B) cAMP content, and ratio of EV cAMP to total cAMP (C) in urine samples from controls (open circles) and ADPKD patients (black dots). * p = 0.02 by unpaired t-test with Welch’s correction.
Figure 5
Figure 5
Urine total content of cAMP in ADPKD is associated with estimated GFR (eGFR) by the MDRD formula (A) and its annual change (Δ eGFR) (B), and chronic kidney disease (CKD) score (C). Regression parameters for (A): R = 0.65, p = 0.012; for (B): R = 0.67, p = 0.008. * CKD score G1 and G2 vs. G3 and G4; p = 0.021 by unpaired t-test with Welch’s correction.
Figure 6
Figure 6
Urine total and EV cAMP contents are related to both total kidney volume (A,C) and Mayo Clinic image classification score (B,D) of ADPKD patients. Regression parameters for (A): R = 0.57, p = 0.044; for (C): R = 0.97, p = 0.0007 for black circles. * Mayo Clinic score 1B and 1C vs. 1D and 1E, p = 0.042 by unpaired t-test with Welch’s correction (B); ** p = 0.0032 by one-way ANOVA, and p < 0.01 vs. 1B and 1D stages by post hoc Tukey’s multiple comparisons test. htTKV: total kidney volume standardized by height.
Figure 7
Figure 7
Schematic diagram illustrating the proposed mechanism of cAMP urine excretion in ADPKD progression. ADPKD progression was characterized by (A) a decline in eGFR (blue area) and an increase in TKV (orange area, expressed as natural logarithm), which correlated with (B) total urine cAMP (green area) diminution, whereas extracellular vesicle (EV) cAMP content increased at a certain point to fall at larger volumes (fuschia area). Taking into account that cystic (yellow) cells have an overproduction of cAMP, we hypothesize that (C) cAMP-EVs (fuschia circles) increase as the kidney grows until cysts are walled off from the tubular tree (light blue cells). According to the “cystic extracellular vesicles/exosomes theory”, EV excretion to the adjacent parenchyma gradually recruits macrophages (green cells) and activates fibroblasts (light-brown cells). Finally, the renal tissue architecture is progressively disrupted, and surrounding normal tissue is replaced by fibrosis, decreasing total (and probably EV) cAMP content in urine. Adapted from [43].

References

    1. Grantham J.J., Mulamalla S., Swenson-Fields K.I. Why kidneys fail in autosomal dominant polycystic kidney disease. Nat. Rev. Nephrol. 2011;7:556–566. doi: 10.1038/nrneph.2011.109. - DOI - PubMed
    1. Franz K.A., Reubi F.C. Rate of functional deterioration in polycystic kidney disease. Kidney Int. 1983;23:526–529. doi: 10.1038/ki.1983.51. - DOI - PubMed
    1. Tazón-Vega B., Vilardell M., Pérez-Oller L., Ars E., Ruiz P., Devuyst O., Lens X., Fernández-Llama P., Ballarín J., Torra R. Study of candidate genes affecting the progression of renal disease in autosomal dominant polycystic kidney disease type 1. Nephrol. Dial. Transplant. 2007;22:1567–1577. doi: 10.1093/ndt/gfm036. - DOI - PubMed
    1. Ferreira F.M., Watanabe E.H., Onuchic L.F. Polycystins and Molecular Basis of Autosomal Dominant Polycystic Kidney Disease. In: Li X., editor. Polycystic Kidney Disease. Codon Publications; Brisbane, Australia: 2015. pp. 139–167. - PubMed
    1. Torres V.E., Harris P.C. Strategies Targeting cAMP Signaling in the Treatment of Polycystic Kidney Disease. J. Am. Soc. Nephrol. 2014;25:18–32. doi: 10.1681/ASN.2013040398. - DOI - PMC - PubMed