. 2023 Aug 23;11(9):2134.
doi: 10.3390/microorganisms11092134.

The Quantitative Measurement of Peptidoglycan Components Obtained from Acidic Hydrolysis in Gram-Positive and Gram-Negative Bacteria via Hydrophilic Interaction Liquid Chromatography Coupled with Mass Spectrometry

Affiliations

The Quantitative Measurement of Peptidoglycan Components Obtained from Acidic Hydrolysis in Gram-Positive and Gram-Negative Bacteria via Hydrophilic Interaction Liquid Chromatography Coupled with Mass Spectrometry

Dmitri Pismennõi et al. Microorganisms. .

Abstract

The high throughput in genome sequencing and metabolic model (MM) reconstruction has democratised bioinformatics approaches such as flux balance analysis. Fluxes' prediction accuracy greatly relates to the deepness of the MM curation for a specific organism starting from the cell composition. One component is the cell wall, which is a functional barrier (cell shape, exchanges) with the environment. The bacterial cell wall (BCW), including its thickness, structure, and composition, has been extensively studied in Escherichia coli but poorly described for other organisms. The peptidoglycan (PG) layer composing the BCW is usually thinner in Gram- bacteria than in Gram+ bacteria. In both bacteria groups, PG is a polymeric mesh-like structure of amino acids and sugars, including N-acetylglucosamine, N-acetylmuramic acid, and amino acids. In this study, we propose a high-throughput method to characterise and quantify PG in Gram-positive and Gram-negative bacteria using acidic hydrolysis and hydrophilic interaction liquid chromatography coupled with mass spectrometry (HILIC-MS). The method showed a relatively short time frame (11 min analytical run), low inter- and intraday variability (3.2% and 4%, respectively), and high sensitivity and selectivity (limits of quantification in the sub mg/L range). The method was successfully applied on two Gram-negative bacteria (Escherichia coli K12 MG1655, Bacteroides thetaiotaomicron DSM 2079) and one Gram-positive bacterium (Streptococcus salivarius ssp. thermophilus DSM20259). The PG concentration ranged from 1.6% w/w to 14% w/w of the dry cell weight. The results were in good correlation with previously published results. With further development, the PG concentration provided by this newly developed method could reinforce the curation of MM.

Keywords: HILIC-MS; biomass composition analysis; glucosamine; hydrolysis; muramic acid; n-acetylglucosamine; n-acetylmuramic acid; peptidoglycan.


Conflict of interest statement

The authors declare no conflict of interest.

Figures

Figure A1
Figure A1
The LC-MS chromatogram obtained after lysozyme application on STH WBM.
Figure A2
Figure A2
The LC-MS chromatogram of NAG (1) obtained during 4 h of acidic hydrolysis.
Figure A3
Figure A3
The LC-MS chromatogram of NAM (2) obtained during 4 h of acidic hydrolysis.
Figure A4
Figure A4
The LC-MS chromatogram of GlcN (3) obtained during 4 h of acidic hydrolysis.
Figure A5
Figure A5
The LC-MS chromatogram of Mur (4) obtained during 4 h of acidic hydrolysis.
Figure 1
Figure 1
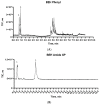
(A) Waters Acquity BEH Phenyl column (2.1 × 100 mm, 1.7 µm). Mobile phases were (MPA) 0.1% FA in ultrapure water and (MPB) MeOH. Gradient elution was used, and the flow rate was 300 µL/min. (B) Waters XBridge BEH Amide XP (3.0 × 150 mm, 2.5 µm). Mobile phases were (MPA) 80/20/0.05 MeCN/ultrapure water/DEA + 0.5 mg/L GuHCl and (MPB) (A) 90/5/5/0.05 MeCN/ultrapure water/isopropanol/DEA + 0.5 mg/L GuHCl. The gradient elution program was used, and the flow rate was 800 µL/min. The methodology was adapted from reference [19]. (C) Phenomenex Luna Omega Sugar (2.1 × 150 mm, 3 µm). The mobile phases were (MPA) 100 ultrapure water + 0.5 mg/L GuHCl and (MPB) 99/1 MeCN/ultrapure water + 0.5 mg/L GuHCl. The gradient elution program was used, and the flow rate was 313 µL/min. The methodology was adapted from reference [20]. (D) Waters Atlantis Premier BEH C18 AX (2.1 × 100 mm, 1.7 µm). The mobile phases were (MPA) 10 mM of AmFor in ultrapure water with pH = 3.75 and (MPB) 90/10 MeCN/10 mM AmFor in ultrapure water with pH = 3.75. The gradient elution program was used, and the flow was set to 300 µL/min. (E) Waters Atlantis Premier BEH Z-HILIC (2.1 × 150 mm, 1.7 µm). The mobile phases were (MPA) 20 mM of AmAc in ultrapure water with pH = 4.75 and (MPB) 90/10 MeCN/20 mM AmAc in ultrapure water with pH = 4.75. The gradient elution program was used, and the flow rate was set to 500 µL/min.
Figure 1
Figure 1
(A) Waters Acquity BEH Phenyl column (2.1 × 100 mm, 1.7 µm). Mobile phases were (MPA) 0.1% FA in ultrapure water and (MPB) MeOH. Gradient elution was used, and the flow rate was 300 µL/min. (B) Waters XBridge BEH Amide XP (3.0 × 150 mm, 2.5 µm). Mobile phases were (MPA) 80/20/0.05 MeCN/ultrapure water/DEA + 0.5 mg/L GuHCl and (MPB) (A) 90/5/5/0.05 MeCN/ultrapure water/isopropanol/DEA + 0.5 mg/L GuHCl. The gradient elution program was used, and the flow rate was 800 µL/min. The methodology was adapted from reference [19]. (C) Phenomenex Luna Omega Sugar (2.1 × 150 mm, 3 µm). The mobile phases were (MPA) 100 ultrapure water + 0.5 mg/L GuHCl and (MPB) 99/1 MeCN/ultrapure water + 0.5 mg/L GuHCl. The gradient elution program was used, and the flow rate was 313 µL/min. The methodology was adapted from reference [20]. (D) Waters Atlantis Premier BEH C18 AX (2.1 × 100 mm, 1.7 µm). The mobile phases were (MPA) 10 mM of AmFor in ultrapure water with pH = 3.75 and (MPB) 90/10 MeCN/10 mM AmFor in ultrapure water with pH = 3.75. The gradient elution program was used, and the flow was set to 300 µL/min. (E) Waters Atlantis Premier BEH Z-HILIC (2.1 × 150 mm, 1.7 µm). The mobile phases were (MPA) 20 mM of AmAc in ultrapure water with pH = 4.75 and (MPB) 90/10 MeCN/20 mM AmAc in ultrapure water with pH = 4.75. The gradient elution program was used, and the flow rate was set to 500 µL/min.
Figure 2
Figure 2
The optimised separation of NAG (1), NAM (2), Mur (3), GlcN (4), and GlcN-13C6 (5) obtained on Waters Atlantis Premier BEH Z-HILIC column in SIR experiments. The zoomed part is shown in normalised TIC levels.

References

    1. Kysela D.T., Randich A.M., Caccamo P.D., Brun Y.V. Diversity Takes Shape: Understanding the Mechanistic and Adaptive Basis of Bacterial Morphology. PLoS Biol. 2016;14:e1002565. doi: 10.1371/journal.pbio.1002565. - DOI - PMC - PubMed
    1. Vollmer W., Blanot D., De Pedro M.A. Peptidoglycan Structure and Architecture. FEMS Microbiol. Rev. 2008;32:149–167. doi: 10.1111/j.1574-6976.2007.00094.x. - DOI - PubMed
    1. Vollmer W., Seligman S.J. Architecture of Peptidoglycan: More Data and More Models. Trends Microbiol. 2010;18:59–66. doi: 10.1016/j.tim.2009.12.004. - DOI - PubMed
    1. Schumann P. Methods in Microbiology. Volume 38. Elsevier; Amsterdam, The Netherlands: 2011. Peptidoglycan Structure; pp. 101–129.
    1. Kanehisa M., Furumichi M., Sato Y., Kawashima M., Ishiguro-Watanabe M. KEGG for Taxonomy-Based Analysis of Pathways and Genomes. Nucleic Acids Res. 2023;51:D587–D592. doi: 10.1093/nar/gkac963. - DOI - PMC - PubMed

LinkOut - more resources