. 2023 Aug 23;11(9):2138.
doi: 10.3390/microorganisms11092138.

Sour Beer as Bioreservoir of Novel Craft Ale Yeast Cultures

Affiliations

Sour Beer as Bioreservoir of Novel Craft Ale Yeast Cultures

Chiara Nasuti et al. Microorganisms. .

Abstract

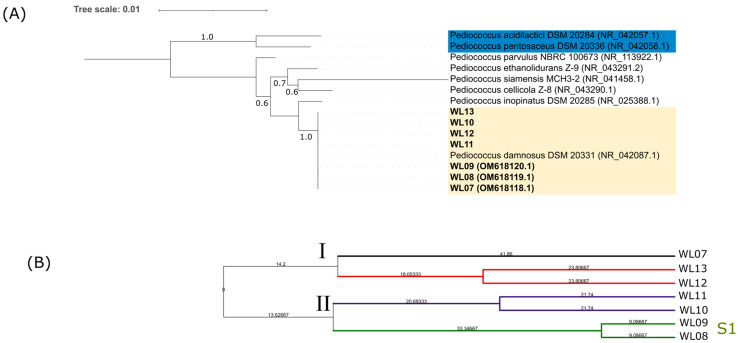
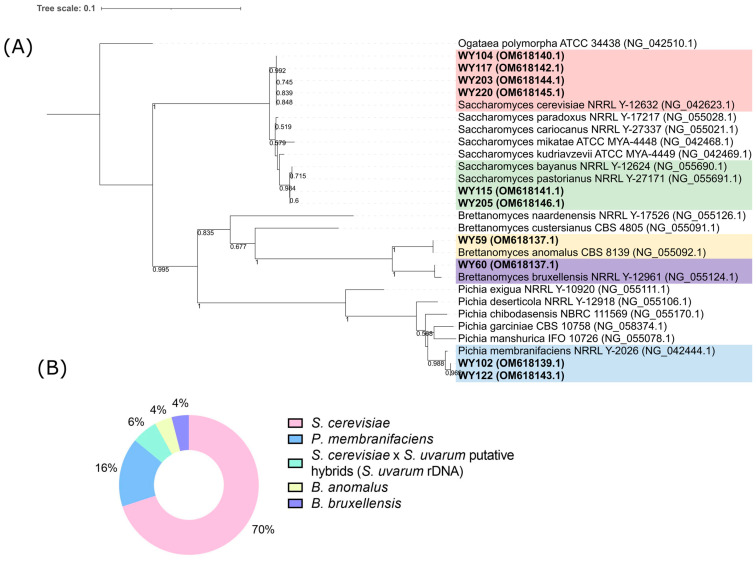
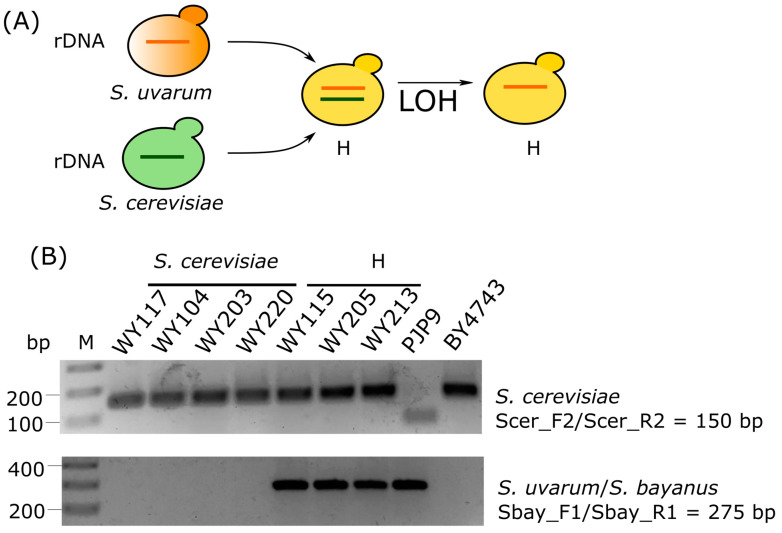
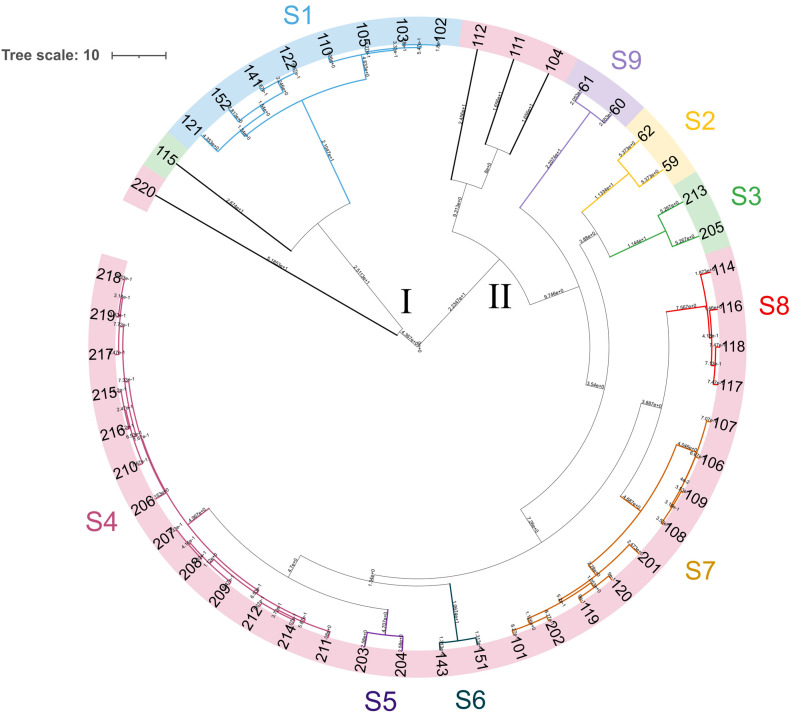
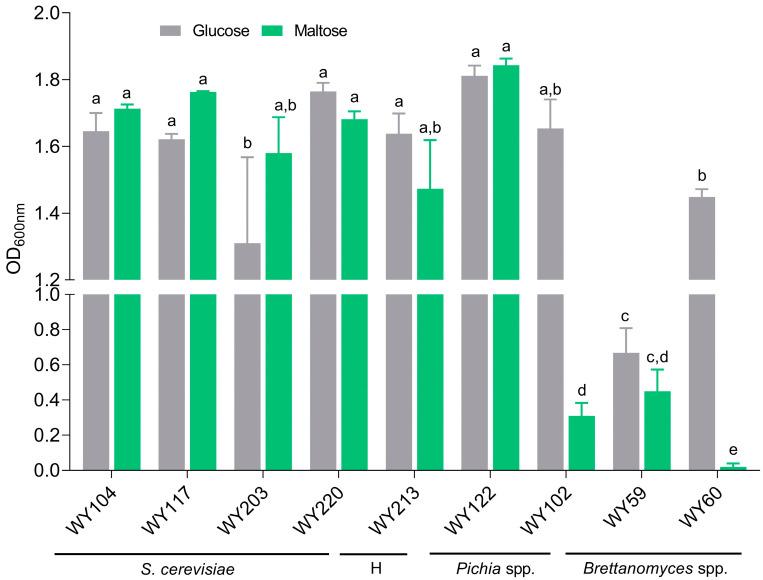
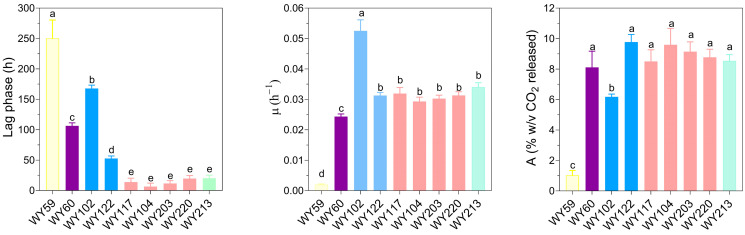
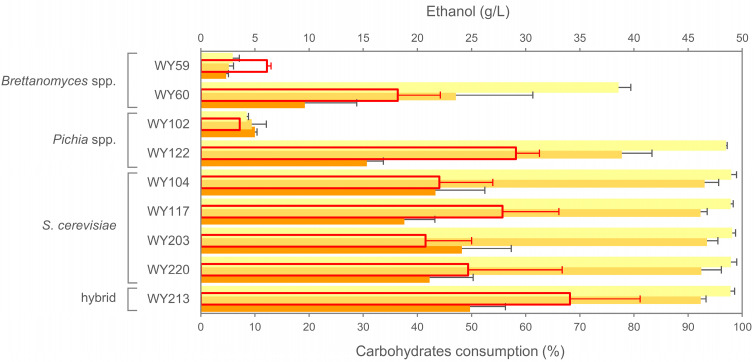
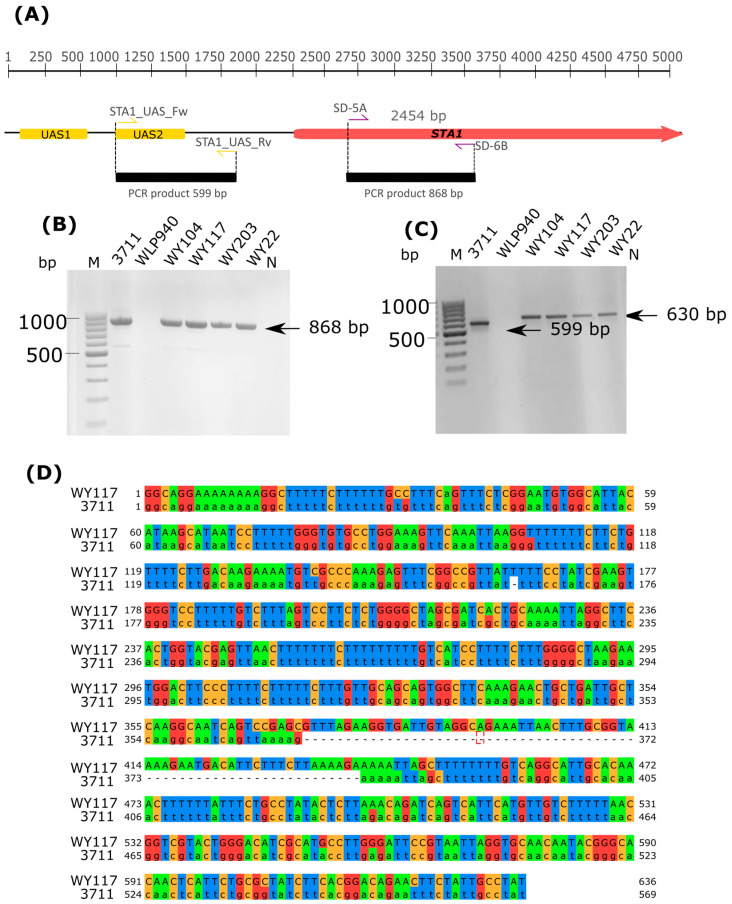
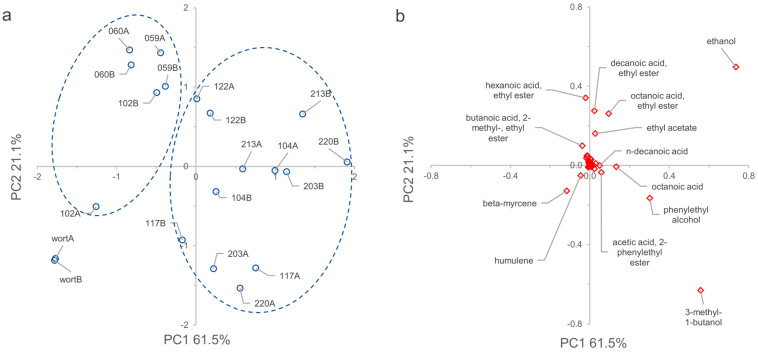
The increasing demand for craft beer is driving the search for novel ale yeast cultures from brewing-related wild environments. The focus of bioprospecting for craft cultures is to identify feral yeasts suitable to imprint unique sensorial attributes onto the final product. Here, we integrated phylogenetic, genotypic, genetic, and metabolomic techniques to demonstrate that sour beer during aging in wooden barrels is a source of suitable craft ale yeast candidates. In contrast to the traditional lambic beer maturation phase, during the aging of sour-matured production-style beer, different biotypes of Saccharomyces cerevisiae dominated the cultivable in-house mycobiota, which were followed by Pichia membranifaciens, Brettanomyces bruxellensis, and Brettanomyces anomalus. In addition, three putative S. cerevisiae × Saccharomyces uvarum hybrids were identified. S. cerevisiae feral strains sporulated, produced viable monosporic progenies, and had the STA1 gene downstream as a full-length promoter. During hopped wort fermentation, four S. cerevisiae strains and the S. cerevisiae × S. uvarum hybrid WY213 exceeded non-Saccharomyces strains in fermentative rate and ethanol production except for P. membranifaciens WY122. This strain consumed maltose after a long lag phase, in contrast to the phenotypic profile described for the species. According to the STA1+ genotype, S. cerevisiae partially consumed dextrin. Among the volatile organic compounds (VOCs) produced by S. cerevisiae and the S. cerevisiae × S. uvarum hybrid, phenylethyl alcohol, which has a fruit-like aroma, was the most prevalent. In conclusion, the strains characterized here have relevant brewing properties and are exploitable as indigenous craft beer starters.

Keywords: Pichia membranifaciens; STA1 gene; Saccharomyces cerevisiae; Saccharomyces uvarum; craft brewing; dextrin; hybrid; sour beer.


Conflict of interest statement

M.D.B. was employed by Ca’ Del Brado Brewery. The funders had no role in the design of the study; in the collection, analyses, or interpretation of data; in the writing of the manuscript; or in the decision to publish the results.

Figures

Figure 1
Figure 1
Flow-chart of semi-spontaneous craft beer fermentation. Red arrow indicates point of sampling.
Figure 2
Figure 2
Phylogenetic and genotyping analysis of LAB isolates. (A) Neighbor-joining tree based on 16S rDNA sequences showing genetic relatedness between Pediococcus damnosus isolates and related species. The evolutionary distances were computed using the Kimura 2-parameter method and the rate variation among sites was modeled with a gamma distribution. Bootstrap values are indicated beside branches (>50%). The tree was rooted with P. acidalictici and P. pentosaceous (blue). (B) UPGMA clustering of LAB isolates based on (GTG)5 rep-PCR fingerprinting analysis. Similarities were calculated as Pearson correlation coefficient with Bionumerics software v8.10. The tree data (Newick) were exported and visualized using ITOL [38].
Figure 3
Figure 3
Species attribution of yeast isolates (bold). (A) Phylogenetic tree obtained by neighbor joining (NJ) method applied to a dataset of 28 D1/D2 26S rDNA sequences. The evolutionary distance was calculated by the Tajima–Nei method. The gamma distribution was used to model the rate of change between sites. The lengths of the branches are proportional to the number of nucleotide substitutions, and they have been measured using the divergence scale shown at the top left. Bootstrap values (1000 replicates) are indicated beside branches (>50%). The tree was rooted with Ogataea polymorpha as outgroup. The tree data (Newick) were exported and visualized using ITOL [38]. Colors of backgrounds were as follows: pink, S. cerevisiae; blue, P. membranifaciens; green, S. cerevisiae × S. uvarum hybrids; yellow, D. anomala; purple, D. bruxellensis. (B) Pie-chart representing species abundance in sour beer: pink, S. cerevisiae; blue, P. membranifaciens; green, S. cerevisiae × S. uvarum hybrids; yellow, D. anomala; purple, D. bruxellensis.
Figure 4
Figure 4
Characterization of Saccharomyces strains by species-specific PCR assays. (A) Illustration of loos of heterozygosity (LOH) occurring in rDNA arrays of hybrid lineages. (B) S. cerevisiae-specific and S. bayanus/S. uvarum-specific PCR assays with Scer_F2/Scer_R2 primers targeting MEX67 gene (amplicon size 150 bp) and primers Sbay_F1/Sbay_R1 targeting DBP6 gene (amplicon size 275 bp), respectively. All tested strains were negative in PCRs targeting S. eubayanus-specific FSY1 gene (amplicon size 228 bp) (Supplementary Figure S4). S. cerevisiae BY4743 and S. uvarum PJP9 were used as internal control. S. cerevisiae strains WY117, WY104, WY203, and WY220 were selected as representative of isolates with pattern A. Abbreviations: M, molecular weight marker; S. cer, S. cerevisiae; Sbay, S. uvarum/S. bayanus; H, hybrid; LOH, loss of heterozygosity.
Figure 5
Figure 5
Dendrogram generated from (GTG)5 rep-PCR fingerprints of 50 sour beer wild yeasts. Similarity percentages were calculated using Pearson correlation coefficient, while hierarchical clustering analysis was carried out using the UPGMA (unweighted pair-group method with arithmetic mean) method with Bionumerics software v8.10. The tree data (Newick) were exported and visualized using ITOL [38]. The similarity value above 92% was used to discriminate biotypes numbered from S1 to S9 and singletons. The color codes are attributed as follows: pink, S. cerevisiae; blue, P. membranifaciens; green, S. cerevisiae × S. uvarum hybrids; yellow, D. anomala; purple, D. bruxellensis.
Figure 6
Figure 6
Maltose (green) and glucose (grey) consumption tests. Statistical differences are indicated with different letters (two-way ANOVA; p < 0.05). Abbreviation: H, S. cerevisiae × S. uvarum hybrid.
Figure 7
Figure 7
Kinetic parameters (lag phase λ, fermentation rate μ, and maximum fermentation efficiency) of yeast candidates in micro-scale wort fermentation (11.5 Plato; 20 °C). Statistical differences are indicated with different letters (one-way ANOVA; p < 0.05). Species was represented as follows: pink, S. cerevisiae; blue, P. membranifaciens; green, S. cerevisiae × S. uvarum hybrids; yellow, B. anomalus; purple, B. bruxellensis.
Figure 8
Figure 8
HPLC analysis of microscale fermentation broths inoculated with selected yeast strains. % consumption of maltose (yellow), maltotriose (light orange) and maltodextrins (orange); ethanol formation (g/L; red). Hybrid: S. cerevisiae × S. uvarum.
Figure 9
Figure 9
Screening for the STA1 gene and related promoter in S. cerevisiae sour beer strains. (A) Strategy to PCR amplify STA1 open reading frame and the promoter region with UAS_1 and UAS_2 located upstream the activation sequence [50]. (B) Individual PCR reactions using primers SD-5A/SD-6B with 3711 as reference strain with “diastatic” phenotype (STA1+, no deletion in STA1 promoter) and WLP940 (STA1−) as reference strain with no diastatic phenotype. (C) Individual PCR reactions using primers STA1_UAS_Fw/STA1_UAS_Rv with 3711 as diastatic reference strain (STA1+, no deletion in STA1 promoter) and WLP940 reference strain with no “diastatic” phenotype (STA1−) as no diastatic control. (D) Nucleotide sequence alignment produced by software Jalview v2.11.2.0 showing UAS2-2 region of WY117 and 3711. Promoter region of diastatic control strain 3711 was retrieved from [50].
Figure 10
Figure 10
VOC profiles of wort and micro-fermented samples reconstructed by headspace SPME–GC–MS analysis, followed by principal component analysis (PCA). (a) Scores plot (PC1 vs. PC2) accounting for 61.5 and 21.1% of variability, respectively. (b) Loading plot of the volatile molecules. The compounds with the highest loading value in PC1 and PC2 are labeled. A and B are replicated samples.

Similar articles

References

    1. Carbone A., Quici L. Craft beer mon amour: An exploration of Italian craft consumers. Br. Food J. 2020;122:2671–2687. doi: 10.1108/BFJ-07-2019-0476. - DOI
    1. Baiano A. Craft beer: An overview. Compr. Rev. Food Sci. Food Saf. 2021;20:1829–1856. doi: 10.1111/1541-4337.12693. - DOI - PubMed
    1. Aquilani B., Laureti T., Poponi S., Secondi L. Beer choice and consumption determinants when craft beers are tasted: An exploratory study of consumer preferences. Food Qual. Pref. 2015;41:214–224. doi: 10.1016/j.foodqual.2014.12.005. - DOI
    1. Viejo C.G., Fuentes S. Beer aroma and quality traits assessment using artificial intelligence. Fermentation. 2020;6:56. doi: 10.3390/fermentation6020056. - DOI
    1. Pires E.J., Teixeira J.A., Brányik T., Vicente A.A. Yeast: The soul of beer’s aroma—A review of flavour-active esters and higher alcohols produced by the brewing yeast. Appl. Microbiol. Biotechnol. 2014;98:1937–1949. doi: 10.1007/s00253-013-5470-0. - DOI - PubMed

LinkOut - more resources