. 2023 Sep 6;11(9):2247.
doi: 10.3390/microorganisms11092247.

Celecoxib-Loaded Cubosomal Nanoparticles as a Therapeutic Approach for Staphylococcus aureus In Vivo Infection

Affiliations

Celecoxib-Loaded Cubosomal Nanoparticles as a Therapeutic Approach for Staphylococcus aureus In Vivo Infection

Samar Zuhair Alshawwa et al. Microorganisms. .

Abstract

There is a great need for novel approaches to treating bacterial infections, due to the vast dissemination of resistance among pathogenic bacteria. Staphylococcus aureus are ubiquitous Gram-positive pathogenic bacteria and are rapidly acquiring antibiotic resistance. Here, celecoxib was encapsulated into cubosomal nanoparticles, and the particle morphology, size distribution, zeta potential, entrapment efficiency, and celecoxib release were evaluated in vitro. Also, a systemic infection model in mice elucidated the in vivo antibacterial action of the celecoxib cubosomes. Cubosomes are a nanotechnology-based delivery system which can adhere to the external peptidoglycan layers of Gram-positive bacteria and penetrate them. The size distribution investigation revealed that the prepared celecoxib-loaded cubosomes had a mean particle size of 128.15 ± 3.04 nm with a low polydispersity index of 0.235 ± 0.023. The zeta potential measurement showed that the prepared cubosomes had a negative surface charge of -17.50 ± 0.45, indicating a highly stable nanodispersion formation with little susceptibility to particle aggregation. The cubosomal dispersion exhibited an entrapment efficiency of 88.57 ± 2.36%. The transmission electron micrograph for the prepared celecoxib-loaded cubosomes showed a narrow size distribution for the cubosomal nanoparticles, which had a spherical shape and were non-aggregated. The tested cubosomes diminished the inflammation in the treated mice's liver and spleen tissues, as revealed by hematoxylin and eosin stain and Masson's trichrome stain. The immunostained tissues with nuclear factor kappa B and caspase-3 monoclonal antibodies revealed a marked decrease in these markers in the celecoxib-treated group, as it resulted in negative or weak immunostaining in liver and spleen that ranged from 4.54% to 17.43%. This indicates their inhibitory effect on the inflammatory pathway and apoptosis, respectively. Furthermore, they reduced the bacterial burden in the studied tissues. This is alongside a decrease in the inflammatory markers (interleukin-1 beta, interleukin-6, cyclooxygenase-2, and tumor necrosis factor-alpha) determined by ELISA and qRT-PCR. The IL-1β levels were 16.66 ± 0.5 pg/mg and 17 ± 0.9 pg/mg in liver and spleen, respectively. Also, IL-6 levels were 85 ± 3.2 pg/mg and 84 ± 2.4 pg/mg in liver and spleen, respectively. In conclusion, the current study introduced cubosomes as an approach for the formulation of celecoxib to enhance its in vivo antibacterial action by improving its oral bioavailability.

Keywords: bacterial infection; histological features; inflammatory markers; nanostructures; oral delivery system; repurposing.


Conflict of interest statement

The authors declare no conflict of interest.

Figures

Figure 1
Figure 1
(A) Size distribution by intensity and (B) zeta distribution for the prepared celecoxib-loaded cubosomes.
Figure 2
Figure 2
(A) Transmission electron photograph and (B) histogram (red line) of size distribution of the prepared celecoxib-loaded cubosomes.
Figure 3
Figure 3
The mean cumulative release of plain celecoxib suspension and celecoxib-loaded cubosomes at pH 6.8.
Figure 4
Figure 4
Growth curve of the studied isolate.
Figure 5
Figure 5
Bacterial load in the liver (A) and spleen (B) of the experimental groups. The double asterisks represent a substantial difference (p < 0.05) between groups III and IV. The triple asterisks denote a substantial difference (p < 0.05) between groups II and IV. Group II: plain celecoxib, group III: blank formula without celecoxib, and group IV: celecoxib cubosomal formulation.
Figure 6
Figure 6
Kaplan–Meier survival curve. Group I: normal control, group II: plain celecoxib, group III: blank formula without celecoxib, and group IV: celecoxib cubosomal formulation.
Figure 7
Figure 7
H&E staining of liver sections of (A) group I with central vein with an average-sized (blue arrows) portal tract (red arrow), bounded by hepatocytes cords, and isolated by blood sinusoids (black arrows) (×100). (B) Group II with central veins of an average size (red arrows) bounded by hepatocytes cords (black arrows) and focal inflammation (blue arrow) with no necrosis (×100). (C) Group III with congested central veins (red arrows) bounded by chronic inflammation (blue arrows) and hepatocytes displaying focal necrosis (black arrows) (×100). (D) Group IV with normal portal tract (red arrow) bounded by normal cords of hepatocytes (black arrows) and few inflammatory cells (blue arrow) with no necrosis (×100). Masson’s trichrome stain of liver sections of (E) group I with normal portal tract and central veins with a slight fibrous wall (black arrows) and absence of fibrosis (score 0) (×100). (F) Group II with fibrous development of certain portal areas and fibrous septa (black arrow) (score 2) (×100). (G) Group III with the fibrous expansion of all portal areas with portal–portal bridging (black arrows) (score 3) (×100). (H) Group IV with fibrous development of a few portal areas with an absence of fibrous septa (black arrow) (score 1) (×100).
Figure 8
Figure 8
H&E staining of spleen sections of (A) group I with white pulp of normal size (lymphoid follicles) (blue arrows) and central arteriole (black arrow) bounded by red pulp of average size (blood sinusoids) (red arrows) (×100). (B) Group II with red pulps that have an average size (red arrows) with short bands of fibrosis (green arrows) bounded by a few atrophic white pulps (blue arrows) (×100). (C) Group III with significant congestion exhibiting mild congested red pulp (red arrows) with extramedullary hematopoiesis showing megakaryocytes (black arrow) with focal fibrosis (green arrows), bounded by some white pulp showing atrophy (blue arrows) (×100). (D) Group IV with normal-sized red pulps (red arrows) bounded by normal-sized white pulp (blue arrows) (×100). Masson’s trichrome stain of spleen sections of (E) group I with parenchyma formed of white (blue arrow) and red pulps (red arrow). The stroma was characterized by minor blue-stained collagen fibers (black arrows) (×100). (F) Group II with a mild decline of collagen fibers with residual streaks of blue-stained collagen fibers (black arrows) (×100). (G) Group III with significant congestion (red arrows), with some areas of blue-stained collagen fibers (black arrows) (×100). (H) Group IV with an obvious decline of the collagen fibers with few collagen streaks (black arrow) (×100).
Figure 9
Figure 9
Immunohistochemical staining of the liver sections of (A) group I with a negative expression of caspase-3 (0.68%) (×100). (B) Group II with a moderate positive caspase-3 expression (45.76%) (×100). (C) Group III with a strong caspase-3-positive expression (73.32%) (×100). (D) Group IV with a negative caspase-3 expression (8.56%) (×100). (E) Group I with a negative expression of NF-kβ (0.74%) (×100). (F) Group II with a moderate expression of NF-kβ (48.28%) (×100). (G) Group III with a strong expression of NF-kβ (72.54%) (×100). (H) Group IV with a negative expression of NF-kβ (6.24%) (×100).
Figure 10
Figure 10
Immunohistochemical staining of the spleen sections of (A) group I with a negative expression of caspase-3 (5.23%) (×100). (B) Group II with a moderate positive caspase-3 expression (47.04%) (×100). (C) Group III with a strong caspase-3-positive expression (79.43%) (×100). (D) Group IV with a weak positive caspase-3 expression (17.43%) (×100). (E) Group I with a negative expression of NF-kβ (2.9%) (×100). (F) Group II with a moderate expression of NF-kβ (29.03%) (×100). (G) Group III with a strong expression of NF-kβ (57.23%) (×100). (H) Group IV with a negative expression of NF-kβ (4.54%) (×100).
Figure 11
Figure 11
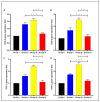
Graph presenting the level of IL-1β in the liver (A) and spleen (B) and showing the level of IL-6 in the liver (C) and spleen (D). The double asterisks represent a substantial difference (p < 0.05) between groups III and IV. The triple asterisks denote a considerable difference (p < 0.05) between groups II and IV. Group I: normal control, group II: plain celecoxib, group III: blank formula without celecoxib, and group IV: celecoxib cubosomal formulation.
Figure 12
Figure 12
A chart revealing the fold change of COX-2 in the liver (A), spleen (B), and TNF-α fold change in (C) in the liver and spleen (D). Group I: normal control, group II: plain celecoxib, group III: blank formula without celecoxib, and group IV: celecoxib cubosomal formulation. The double asterisks represent a substantial difference (p < 0.05) between groups III and IV. The triple asterisks denote a considerable difference (p < 0.05) between groups II and IV.

References

    1. Tong S.Y., Davis J.S., Eichenberger E., Holland T.L., Fowler V.G., Jr. Staphylococcus aureus infections: Epidemiology, pathophysiology, clinical manifestations, and management. Clin. Microbiol. Rev. 2015;28:603–661. doi: 10.1128/CMR.00134-14. - DOI - PMC - PubMed
    1. Serwecińska L. Antimicrobials and antibiotic-resistant bacteria: A risk to the environment and to public health. Water. 2020;12:3313. doi: 10.3390/w12123313. - DOI
    1. Attallah N.G., El-Kadem A.H., Negm W.A., Elekhnawy E., El-Masry T.A., Elmongy E.I., Altwaijry N., Alanazi A.S., Al-Hamoud G.A., Ragab A.E. Promising Antiviral Activity of Agrimonia pilosa Phytochemicals against Severe Acute Respiratory Syndrome Coronavirus 2 Supported with In Vivo Mice Study. Pharmaceuticals. 2021;14:1313. doi: 10.3390/ph14121313. - DOI - PMC - PubMed
    1. Wang X., Koffi P.F., English O.F., Lee J.C. Staphylococcus aureus extracellular vesicles: A story of toxicity and the stress of 2020. Toxins. 2021;13:75. doi: 10.3390/toxins13020075. - DOI - PMC - PubMed
    1. El-Banna T., Abd El-Aziz A., Sonbol F., El-Ekhnawy E. Adaptation of Pseudomonas aeruginosa clinical isolates to benzalkonium chloride retards its growth and enhances biofilm production. Mol. Biol. Rep. 2019;46:3437–3443. doi: 10.1007/s11033-019-04806-7. - DOI - PubMed