. 2023 Sep 14;28(18):6609.
doi: 10.3390/molecules28186609.

Cuban Policosanol (Raydel®) Potently Protects the Liver, Ovary, and Testis with an Improvement in Dyslipidemia in Hyperlipidemic Zebrafish: A Comparative Study with Three Chinese Policosanols

Affiliations

Cuban Policosanol (Raydel®) Potently Protects the Liver, Ovary, and Testis with an Improvement in Dyslipidemia in Hyperlipidemic Zebrafish: A Comparative Study with Three Chinese Policosanols

Kyung-Hyun Cho et al. Molecules. .

Abstract

Many policosanols from different sources, such as sugar cane and rice bran, have been marketed worldwide to improve blood lipid profiles. But so far, no comparative study has commenced elucidating the effect of different policosanols to improve the blood lipid profile and other beneficial effects. This study compared the efficacy of four different policosanols, including one sugar cane wax alcohol from Cuba (Raydel®) and three policosanols from China (Xi'an Natural sugar cane, Xi'an Realin sugar cane, and Shaanxi rice bran), to treat dyslipidemia in hyperlipidemic zebrafish. After 12 weeks of consumption of each policosanol (final 0.1% in diet, wt/wt) and a high-cholesterol diet (HCD, final 4%, wt/wt), the Raydel policosanol group and the Xi'an Natural policosanol group showed the highest survivability, of approximately 81%. In contrast, the Xi'an Realin policosanol and the Shaanxi policosanol groups showed 57% and 67% survivability, respectively. Among the five HCD groups, the Raydel policosanol group showed the lowest serum total cholesterol (TC, p < 0.001 versus HCD control) and triglyceride (p < 0.001 versus HCD control), with the highest percentage of high-density lipoproteins-cholesterol in TC. The Raydel policosanol group also showed the lowest serum aspartate aminotransferase and alanine aminotransferase levels, with the least infiltration of inflammatory cells and interleukin-6 production in hepatocytes with a marked reduction in reactive oxygen species (ROS) production and fatty liver changes. In the ovary, the Raydel policosanol group also showed the highest content of mature vitellogenic oocytes with the lowest production of reactive oxygen species and cellular apoptosis in ovarian cells. In the testes, the Raydel policosanol group also showed the healthiest morphology for spermatogenesis, with the lowest interstitial area and reactive oxygen species production in testicular cells. Conclusively, among the tested policosanols, Cuba (Raydel®) policosanol exhibited a comparatively better effect in maintaining zebrafish body weight, survivability, blood lipid profile, hepatic function biomarkers, fatty liver changes, ROS generation, inflammation, and restoration of the cell morphology in ovaries and testes affected by the HCD consumption.

Keywords: apoA-I; high-cholesterol diet; high-density lipoproteins; inflammation; interleukin-6; liver; ovary; policosanol; testis.


Conflict of interest statement

The authors declare no conflict of interest.

Figures

Figure 1
Figure 1
Change in survivability (A) and body weight (B) during 12 weeks’ supplementation of each policosanol under high-cholesterol diet. HCD, high-cholesterol diet; ND, normal diet; PCO1, Raydel policosanol; PCO2, Xi’an Natural policosanol; PCO3, Xi’an Realin policosanol; PCO4, Shaanxi policosanol. Numerical values in the blue font indicate dead zebrafish numbers during 12 weeks of consumption. Data are expressed as mean ± SEM. Statistical differences in multiple groups were compared using a one-way analysis of variance (ANOVA) with Dunnett’s post hoc test. *, p < 0.05 versus HCD control; ***, p < 0.001 versus HCD control; ns, not significant versus HCD control.
Figure 2
Figure 2
Total cholesterol (TC), triglyceride (TG), high-density lipoproteins cholesterol (HDL-C), and the HDL-C and total cholesterol ratio (HDL-C/TC, %) in the blood after 12 weeks of supplementation of each policosanol (PCO) under high-cholesterol diet consumption. HCD, high-cholesterol diet; ND, normal diet; PCO1, Raydel policosanol; PCO2, Xi’an Natural policosanol; PCO3, Xi’an Realin policosanol; PCO4, Shaanxi policosanol. Data are expressed as mean ± SEM. Statistical differences between multiple groups were compared using a one-way analysis of variance (ANOVA) with Dunnett’s post hoc test between the other group and the HCD group. *, p < 0.05 versus HCD control; **, p < 0.01 versus HCD control; ***, p < 0.001 versus HCD control. ns, not significant versus HCD control.
Figure 3
Figure 3
Comparison of the blood hepatic damage parameters of aspartate aminotransferase (AST) and alanine aminotransferase (AST) after 12 weeks supplementation of each policosanol under high-cholesterol diet consumption. HCD, high-cholesterol diet; ND, normal diet; PCO1, Raydel policosanol; PCO2, Xi’an Natural policosanol; PCO3, Xi’an Realin policosanol; PCO4, Shaanxi policosanol. Data are expressed as mean ± SEM. Statistical differences in multiple groups were compared using a one-way analysis of variance (ANOVA) with Dunnett’s post hoc test between the other group and the HCD group. *, p < 0.05 versus HCD control; **, p < 0.01 versus HCD control; ns, not significant.
Figure 4
Figure 4
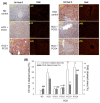
Observation of neutrophil infiltration in hepatic tissue from zebrafish after 12 weeks of supplementation of each policosanol (PCO) under high-cholesterol diet consumption. HCD, high-cholesterol diet; ND, normal diet; PCO1, Raydel policosanol; PCO2, Xi’an Natural policosanol; PCO3, Xi’an Realin policosanol; PCO4, Shaanxi policosanol. (A) Photographs showing the infiltration of neutrophils (blue arrow) and lipid droplets (red arrow) by hematoxylin & eosin (H&E) staining at 400× and 1000× magnification. Scale bar for 400× images (100 μm) and for 1000× magnified images (10 μm). (B) Determination of numbers in infiltrated neutrophils from the H&E staining using Image J software (http://rsb.info.nih.gov/ij/, accessed on 16 May 2023). The number of neutrophils (stained dark violet to blue color) of each group per designated area (1.23 mm2) was counted across five sections with every five views to obtain a semi-quantitative estimation of neutrophil infiltration. The statistical significance of the groups was indicated as p values at the top of the graph. Data are expressed as mean ± SEM. Statistical differences of multiple groups were compared using a one-way analysis of variance (ANOVA) with Dunnett’s post hoc test between the other group and the HCD group. ***, p < 0.001 versus HCD control.
Figure 5
Figure 5
Comparisons of the fatty liver alteration and reactive oxygen species (ROS) examined by oil red O staining and dihydroethidium (DHE) staining, respectively, in zebrafish after 12 weeks of supplementation of each policosanol (PCO) under high-cholesterol diet consumption. HCD, high-cholesterol diet; ND, normal diet; PCO1, Raydel policosanol; PCO2, Xi’an Natural policosanol; PCO3, Xi’an Realin policosanol; PCO4, Shaanxi policosanol. (A) Exemplary images of oil red O stained (a1f1) and DHE-stained (a2f2) hepatic tissue of zebrafish sacrificed after 12 weeks’ consumption [scale bar = 100 μm]. (B) Assessment of the oil red O intensity and DHE fluorescence (Ex = 585 nm, Em = 615 nm) intensity employing Image J software (http://rsb.info.nih.gov/ij/, accessed on 16 May 2023). ***, p < 0.001 versus HCD from the oil red O stained area; Data are expressed as mean ± SEM. Statistical differences of multiple groups were compared using a one-way analysis of variance (ANOVA) with Dunnett’s post hoc test between the other group and the HCD group. #, p < 0.05 versus HCD from the DHE-stained area; ##, p < 0.01 versus HCD from the DHE-stained area; ###, p < 0.001 versus HCD from the DHE-stained area ns, not significant.
Figure 6
Figure 6
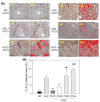
Comparison of the interleukin (IL)-6-stained area of immunohistochemistry (IHC) with hepatic tissue from zebrafish after 12 weeks’ supplementation of each policosanol (PCO) under high-cholesterol diet consumption. HCD, high-cholesterol diet; ND, normal diet; PCO1, Raydel policosanol; PCO2, Xi’an Natural policosanol; PCO3, Xi’an Realin policosanol; PCO4, Shaanxi policosanol. (A) Exemplary images (a1a6) of IL-6-stained hepatic tissue after 12 weeks of consumption. The images (b1b6) depict the IL-6 stained brown color, interchanged with red color [at brown color threshold value of lower limit (20) and upper limit (120)] to intensify the visualization of the IL-6-stained area using Image J software (http://rsb.info.nih.gov/ij/, accessed on 16 May 2023). The scale bar indicates 100 μm. (B) Assessment of the IL-6-stained area using Image J software (http://rsb.info.nih.gov/ij/, accessed on 16 May 2023). Data are expressed as mean ± SEM. Statistical differences in multiple groups were compared using a one-way analysis of variance (ANOVA) with Dunnett’s post hoc test between the other group and the HCD group. **, p < 0.01 versus HCD; ***, p < 0.001 versus HCD; ##, p < 0.01 versus HCD; ###, p < 0.001 versus HCD.
Figure 7
Figure 7
Comparisons of the ovarian cell morphology according to hematoxylin and eosin (H&E) staining, extent of reactive oxygen species (ROS) via dihydroethidium (DHE) staining, and the extent of apoptosis via acridine orange (AO) staining in zebrafish after 12 weeks’ supplementation of each policosanol (PCO) under high-cholesterol diet consumption. HCD, high-cholesterol diet; ND, normal diet; PCO1, Raydel policosanol; PCO2, Xi’an Natural policosanol; PCO3, Xi’an Realin policosanol; PCO4, Shaanxi policosanol. Data are documented as mean ± SEM. Statistical differences in multiple groups were compared using a one-way analysis of variance (ANOVA) with Dunnett’s post hoc test between the other group and the HCD group. (A) Representative images of H&E-stained, DHE-stained, and AO-stained ovarian cells. The scale bar indicates 100 μm. E, early vitellogenic oocytes; M, mature vitellogenic oocytes; P, pre-vitellogenic oocytes. (B) The percentage distribution of the stages in oocytes depends on the developmental stage. ***, p < 0.001 versus HCD in early and mature vitellogenic; ###, p < 0.01 versus HCD in pre-vitellogenic; *, p < 0.05 versus HCD in mature-vitellogenic. (C) Quantification of the DHE fluorescence (Ex = 585 nm, Em = 615 nm) intensity and acridine orange fluorescence in oocytes (Ex = 505 nm, Em = 535 nm) using Image J software (http://rsb.info.nih.gov/ij/, accessed on 16 May 2023). *, p < 0.05 versus HCD from the DHE-stained area; ##, p < 0.01 versus HCD from AO-stained area; #, p < 0.05 versus HCD from the AO-stained area; ns, not significant.
Figure 8
Figure 8
Comparison of the testicular histology in zebrafish after 12 weeks’ supplementation of each policosanol (PCO) under high-cholesterol diet consumption. HCD, high-cholesterol diet; ND, normal diet; PCO1, Raydel policosanol; PCO2, Xi’an Natural policosanol; PCO3, Xi’an Realin policosanol; PCO4, Shaanxi policosanol. (A) Representative images (a1a6) of an H&E-stained testicular section. The images (b1b6) depict the interstitial spaces in seminiferous tubules’ void areas (white color), interchanged with red color [at threshold values of lower limit (220) and upper limit (255)] to intensify the visualization of the interstitial spaces using Image J software (http://rsb.info.nih.gov/ij/, accessed on 16 May 2023). The scale bar indicates 100 μm. SC, spermatocytes; SG, spermatogonia; ST, spermatid; SZ, spermatozoa. (B) Quantification of the red area to compare the interstitial space in the testis using Image J software (http://rsb.info.nih.gov/ij/, accessed on 16 May 2023). Data are presented as mean ± SEM. Statistical differences of multiple groups were compared using a one-way analysis of variance (ANOVA) with Dunnett’s post hoc test between the other group and the HCD group. *, p < 0.05 versus HCD; **, p < 0.01 versus HCD; ns, not significant.
Figure 9
Figure 9
Comparison of the testicular cell morphology via hematoxylin and eosin (H&E) staining, the extent of reactive oxygen species (ROS) via dihydroethidium (DHE) staining, and the extent of apoptosis via acridine orange (AO) staining in zebrafish after 12 weeks’ supplementation of each policosanol (PCO) under a high-cholesterol diet. HCD, high-cholesterol diet; ND, normal diet; PCO1, Raydel policosanol; PCO2, Xi’an Natural policosanol; PCO3, Xi’an Realin policosanol; PCO4, Shaanxi policosanol. (A) Representative image of H&E-stained, DHE-stained, and AO-stained images of a testicular cell. The red arrow indicates increased interstitial area (scale bar = 100 μm). (B) Quantification of the DHE fluorescence intensity (Ex = 585 nm, Em = 615 nm) and AO fluorescence intensity (Ex = 505 nm, Em = 535 nm) using Image J software (http://rsb.info.nih.gov/ij/, accessed on 16 May 2023). Data are presented as mean ± SEM. Statistical differences of multiple groups were compared using a one-way analysis of variance (ANOVA) with Dunnett’s post hoc test between the other group and the HCD group. **, p < 0.01 versus HCD from DHE-stained area; ***, p < 0.001 versus HCD from DHE-stained area; ###, p < 0.001 versus HCD from the AO-stained area; ns, not significant.
Figure 10
Figure 10
The beneficial effect of Cuban policosanol (Raydel®) in blood, liver, ovary, and testis after 12 weeks’ supplementation in hyperlipidemic zebrafish. AST, aspartate aminotransferase; ALT, alanine aminotransferase; HDL, high-density lipoproteins; IL-6, interleukin-6; ROS, reactive oxygen species; TC, total cholesterol; TG, triglyceride.

References

    1. Cho K.-H. The Current Status of Research on High-Density Lipoproteins (HDL): A Paradigm Shift from HDL Quantity to HDL Quality and HDL Functionality. Int. J. Mol. Sci. 2022;23:3967. doi: 10.3390/ijms23073967. - DOI - PMC - PubMed
    1. Milman S., Atzmon G., Crandall J., Barzilai N. Phenotypes and genotypes of high density lipoprotein cholesterol in exceptional longevity. Curr. Vasc. Pharmacol. 2014;12:690–697. doi: 10.2174/1570161111666131219101551. - DOI - PMC - PubMed
    1. Gotto A.M., Jr. Low high-density lipoprotein cholesterol as a risk factor in coronary heart disease: A working group report. Circulation. 2001;103:2213–2218. doi: 10.1161/01.CIR.103.17.2213. - DOI - PubMed
    1. Franczyk B., Gluba-Brzózka A., Ciałkowska-Rysz A., Ławiński J., Rysz J. The Impact of Aerobic Exercise on HDL Quantity and Quality: A Narrative Review. Int. J. Mol. Sci. 2023;24:4653. doi: 10.3390/ijms24054653. - DOI - PMC - PubMed
    1. Tangvarasittichai S. Oxidative stress, insulin resistance, dyslipidemia and type 2 diabetes mellitus. World J. Diabetes. 2015;6:456–480. doi: 10.4239/wjd.v6.i3.456. - DOI - PMC - PubMed

LinkOut - more resources