. 2023 Sep 21;28(18):6728.
doi: 10.3390/molecules28186728.

Myrcene: A Natural Compound Showing Anticancer Activity in HeLa Cells

Affiliations

Myrcene: A Natural Compound Showing Anticancer Activity in HeLa Cells

Luca Pincigher et al. Molecules. .

Abstract

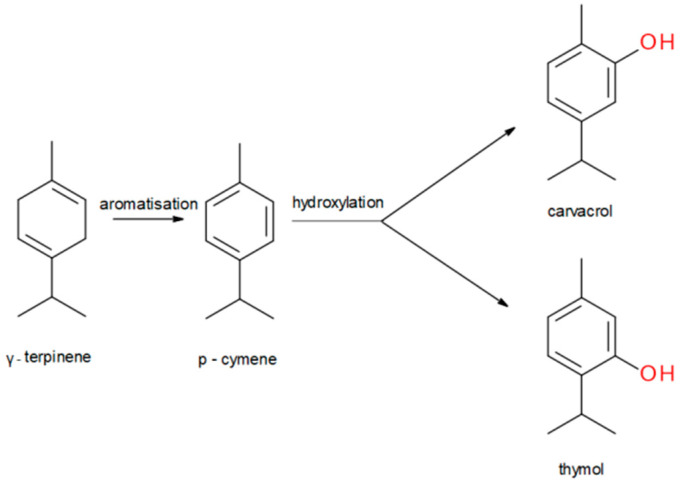
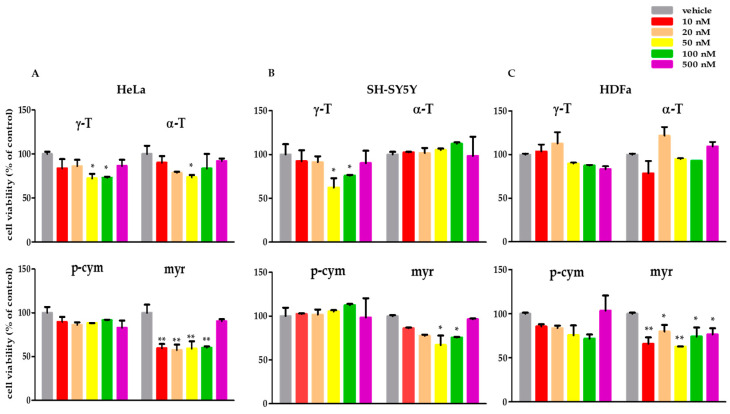
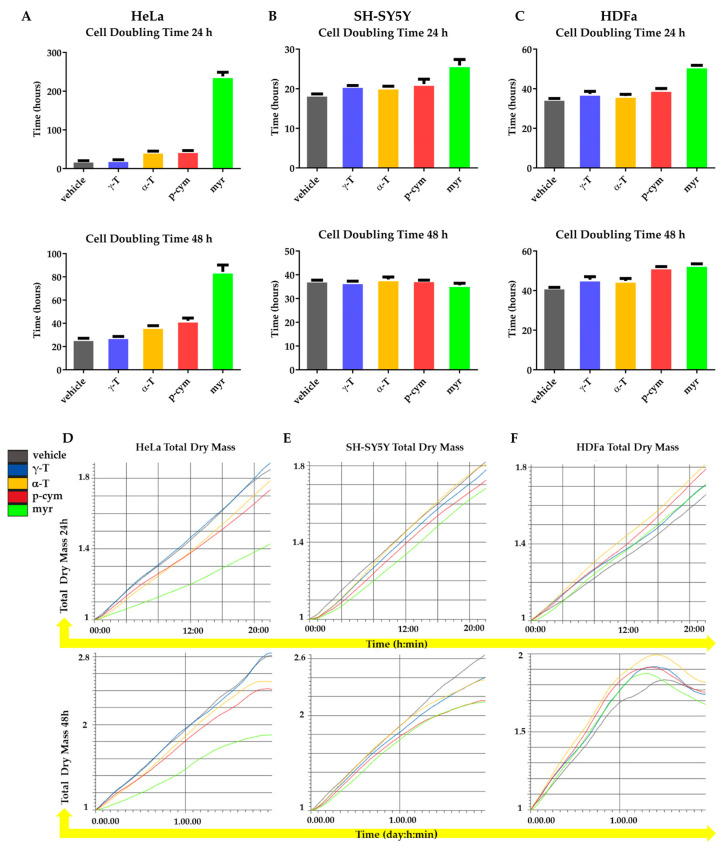
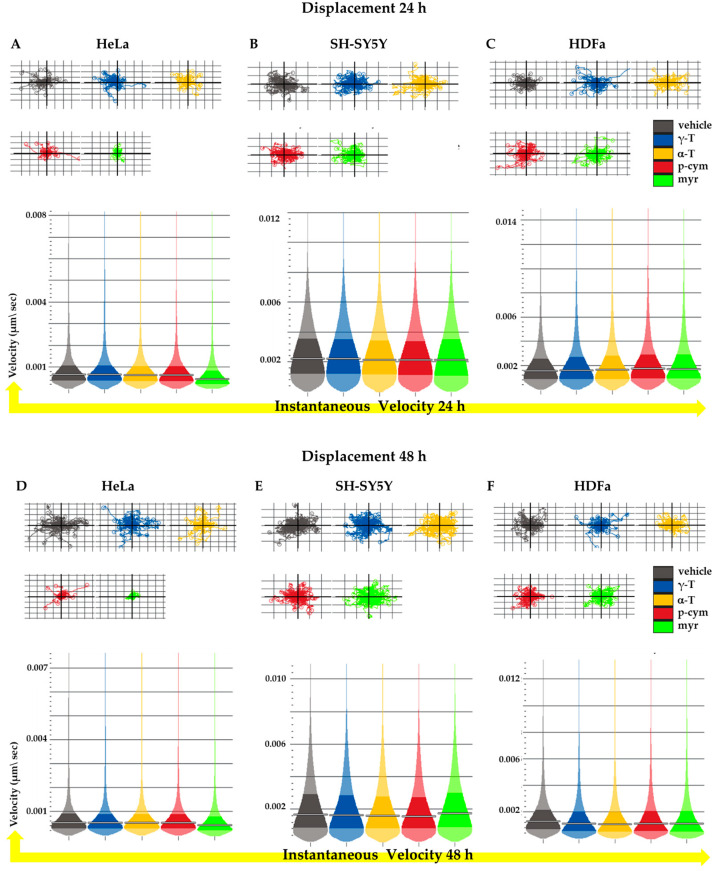
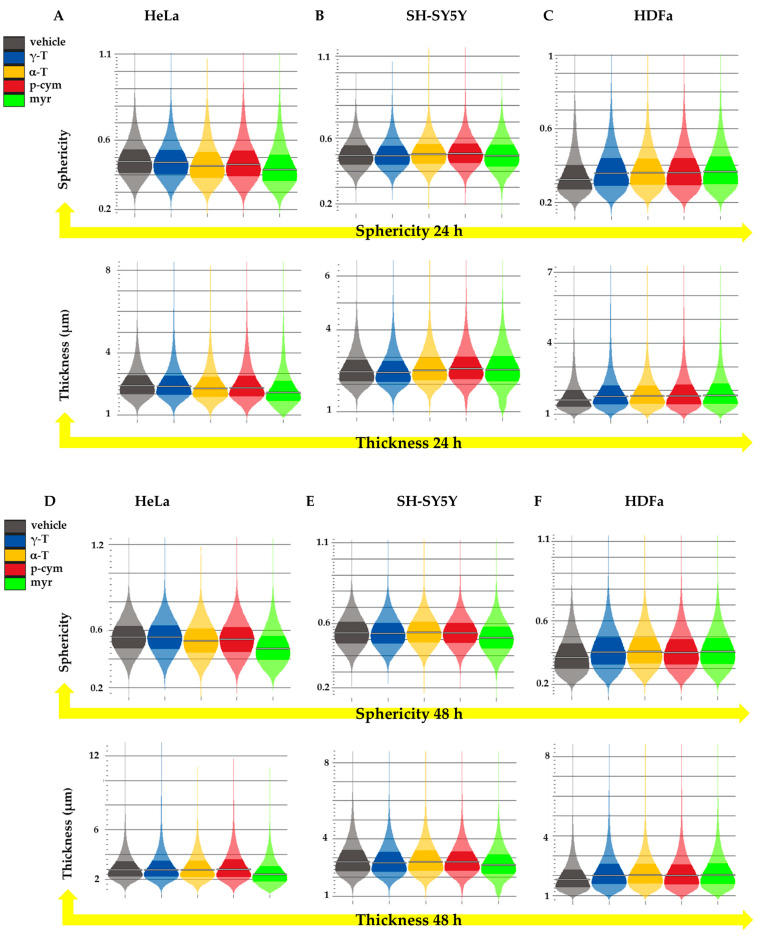
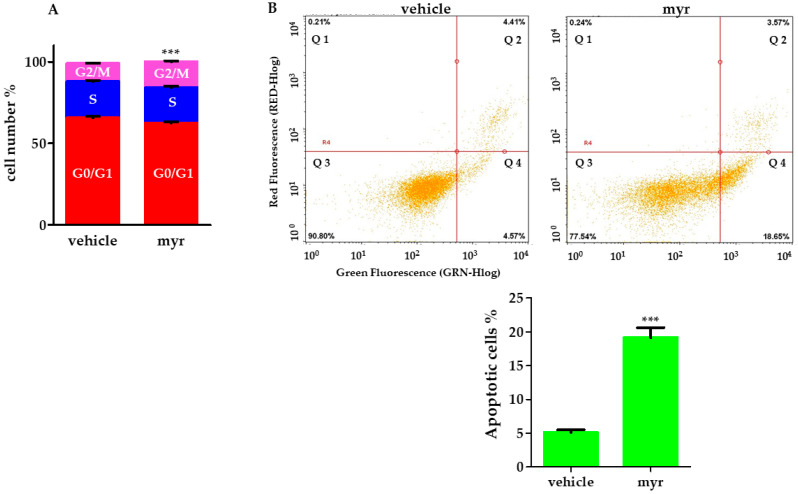
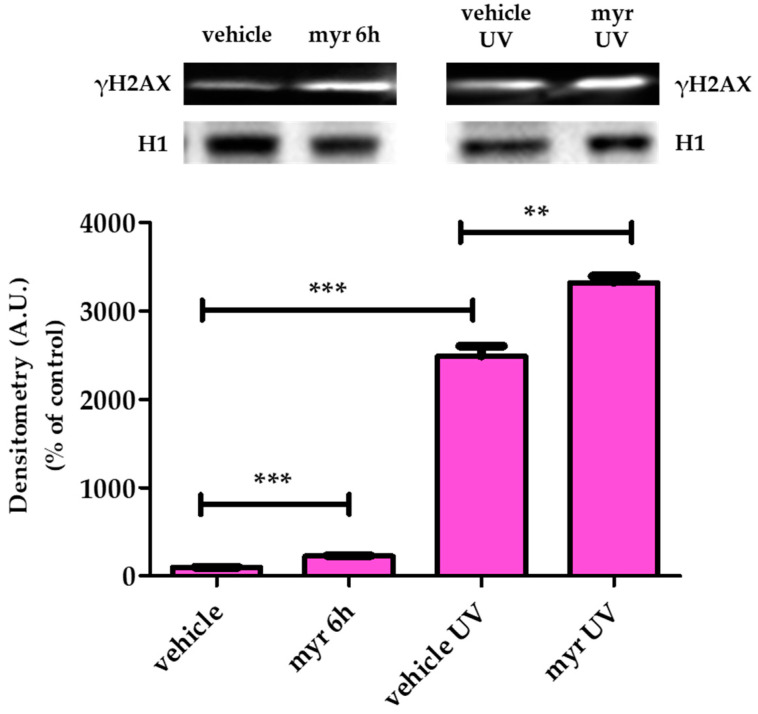
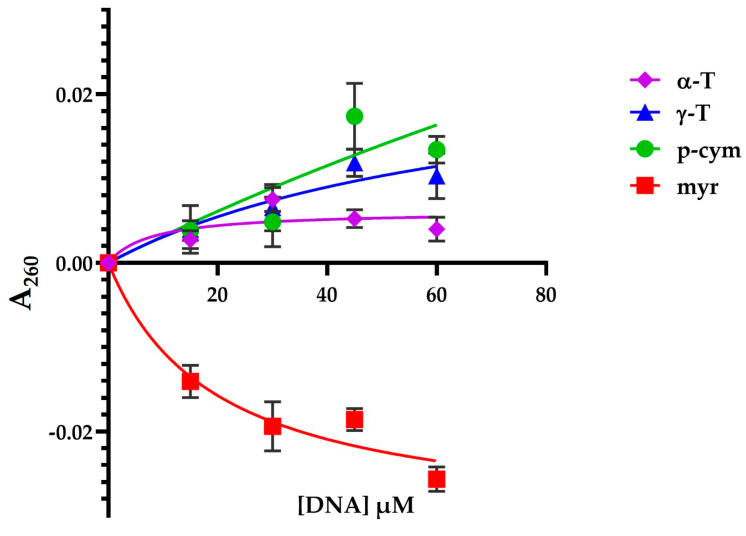
γ-terpinene, α-terpinene, p-cymene, and myrcene are monoterpenes found in many essential oils extracted from a variety of plants and spices. Myrcene also occurs naturally in plants such as hops, cannabis, lemongrass, and verbena and is used as a flavoring agent in food and beverage manufacturing. In this research, the biological efficacy of γ-terpinene, α-terpinene, p-cymene, and myrcene was studied in human cell lines (HeLa, SH-SY5Y, and HDFa). Cytotoxicity, cell proliferation, cell migration, and morphology assays were performed to obtain detailed information on the anticancer properties. Our results show that myrcene has potential biological activity, especially in HeLa cells. In this cell line, it leads to an arrest of proliferation, a decrease in motility and morphological changes with loss of sphericity and thickness, and DNA damage. In addition, the interaction of γ-terpinene, α-terpinene, p-terpinene, and myrcene with calf thymus DNA (ct-DNA) was studied by UV-visible spectrophotometry. DNA binding experiments show that only myrcene can interact with DNA with an apparent dissociation constant (Kd) of 29 × 10-6 M.

Keywords: cancer; cell cycle; monoterpenes; myrcene.


Conflict of interest statement

The authors declare no conflict of interest.

Figures

Figure 1
Figure 1
Scheme of the key steps of thymol and carvacrol biosynthesis [15].
Figure 2
Figure 2
Structures of α-terpinene, γ-terpinene, p-cymene, and myrcene [16].
Figure 3
Figure 3
Cell viability of human malignant and non-malignant cells analyzed with MTT viability assay. The cells were treated for 24 h with increasing concentrations (10–500 nM) of γ-T, α-T, p-cym, and myr dissolved in DMSO (vehicle control). (A) HeLa, (B) SH-SY5Y, and (C) HDFa. Error bars are standard deviations. Significant differences are indicated as * p < 0.05, ** p < 0.01, significantly different from control (vehicle).
Figure 4
Figure 4
Quantitative phase imaging (QPI). Representative images of HeLa (A), SH-SY5Y (B), and HDFa (C) cells acquired at 0 h, 24 h, and 48 h of incubation with 50 nM of γ-T, α-T, p-cym, and myr. Scale bars: 200 µm.
Figure 5
Figure 5
Effect of γ-T, α-T, p-cym, and myr treatment on cell proliferation. Cells have been treated (or not) with 50 nM compounds for 24 or 48 h. Above: histogram plot illustrates median cell doubling time for HeLa (A), SH-SY5Y (B), and HDFa (C) cells. Below: panels illustrate total dry mass for HeLa (D), SH-SY5Y (E), and HDFa (F). The different line colors correspond to the legend.
Figure 6
Figure 6
Analysis of cellular motility. (Above) Average confinement ratio of HeLa (A,D), SH-SY5Y (B,F), and HDFa (C,F) cells upon 24 or 48 h of treatment with different compounds at the concentration of 50 nM. Average velocity of HeLa (A,D), SH-SY5Y (B,E), and HDFa (C,F) cells upon 24 or 48 h treatment. Error bars represent the inter-quartile range.
Figure 7
Figure 7
Analysis of cellular morphology. (Above) Average sphericity of HeLa (A,D), SH-SY5Y (B,E), and HDFa (C,F) cells upon 24 or 48 h of treatment with different compounds at the concentration of 50 nM. (Below) Average thickness of HeLa (A,D), SH-SY5Y (B,E), and HDFa (C,F) cells upon 24 or 48 h treatment. Error bars represent the inter-quartile range.
Figure 8
Figure 8
Flow cytometric analysis of cell cycle and apoptosis. (A) HeLa cells were treated with 50 nM myr for 24 h and then analyzed using flow cytometry. Error bars are standard deviations. Significant differences are indicated by *** p < 0.001 significantly different from control (vehicle). (B) Top. Representative images of dot plots of annexin V-FITC/PI. Cytofluorimetric analysis of annexin V-FITC- and PI-stained cells in vehicle (control) and after 24-h treatment with 50 nM myr. Four quadrants represent Q1 necrotic cells (annexin V/negative; PI/positive), Q2 late apoptotic cells (annexin V/positive; PI/positive), Q3 viable cells (annexin V/negative; PI/negative), and Q4 early apoptotic cells (annexin V/positive; PI/negative). Numbers indicate the percentage of cells in each quadrant, and at least 5000 events were read (n = 3). Bottom. Quantitative analysis of cell apoptosis with annexin V/PI double staining in flow cytometry. Data were presented as mean ± SD of three independent experiments performed in triplicate. *** p < 0.001, compared with vehicle.
Figure 9
Figure 9
Myr induces DNA damage in HeLa cells. (Above) Representative Western blot image of γH2AX in HeLa cells treated with myr (50 nM), exposed to UV, or treated with myr and UV for 6 h. (Below) Relative quantification. Arbitrary densitometry units (A.U.) were normalized by H1 histone. All data represent mean ± SD (n = 6). ** p < 0.01, *** p < 0.001, significantly different from control (vehicle).
Figure 10
Figure 10
Differential absorbance at 260 nm of DNA-molecule complexes at increasing DNA concentration. Molecule concentration is 50 nM.

References

    1. Mandal D., Sarkar T., Chakraborty R. Critical Review on Nutritional, Bioactive, and Medicinal Potential of Spices and Herbs and Their Application in Food Fortification and Nanotechnology. Appl. Biochem. Biotechnol. 2023;195:1319–1513. doi: 10.1007/s12010-022-04132-y. - DOI - PMC - PubMed
    1. Wagner K.-H., Elmadfa I. Biological Relevance of Terpenoids. Ann. Nutr. Metab. 2003;47:95–106. doi: 10.1159/000070030. - DOI - PubMed
    1. Crowell P.L. Prevention and Therapy of Cancer by Dietary Monoterpenes. J. Nutr. 1999;129:775S–778S. doi: 10.1093/jn/129.3.775S. - DOI - PubMed
    1. Gould M.N. Cancer Chemoprevention and Therapy by Monoterpenes. Environ. Health Perspect. 1997;105:977–979. doi: 10.1289/ehp.97105s4977. - DOI - PMC - PubMed
    1. Silva B.I.M., Nascimento E.A., Silva C.J., Silva T.G., Aguiar J.S. Anticancer Activity of Monoterpenes: A Systematic Review. Mol. Biol. Rep. 2021;48:5775–5785. doi: 10.1007/s11033-021-06578-5. - DOI - PubMed

LinkOut - more resources