. 2023 Sep 9;13(18):2526.
doi: 10.3390/nano13182526.

Strain versus Tunable Terahertz Nanogap Width: A Simple Formula and a Trench below

Affiliations

Strain versus Tunable Terahertz Nanogap Width: A Simple Formula and a Trench below

Hwanhee Kim et al. Nanomaterials (Basel). .

Abstract

A flexible zerogap metallic structure is periodically formed, healing metal cracks on a flexible substrate. Zerogap is continuously tunable from nearly zero to one hundred nanometers by applying compressive strains on the flexible substrate. However, there have been few studies on how the gap width is related to the strain and periodicity, nor the mechanism of tunability itself. Here, based on atomic force microscopy (AFM) measurements, we found that 200 nm-deep nano-trenches are periodically generated on the polymer substrate below the zerogap owing to the strain singularities extant between the first and the second metallic deposition layers. Terahertz and visible transmission properties are consistent with this picture whereby the outer-bending polyethylene terephthalate (PET) substrate controls the gap size linearly with the inverse of the radius of the curvature.

Keywords: diffraction pattern; gaptronics; nano-trench; nanogap; pet substrate; terahertz; tunable zerogap.


Conflict of interest statement

The authors declare no conflict of interest.

Figures

Figure 1
Figure 1
Zerogap sample and stage image information. (a,d) shows the zerogap sample image with the micrometer stage. The effective arc length of the sample is 17.4 mm. dx is the absolute value of the sample displacements shown in the blue line in (d). (b,c) is the normal 5 μm period 100× optical microscope image of reflection and transmission illumination. The white line on the image is the scale bar, which is 10 μm (e,f) is the 2.04 cm−1 radius of curvature (dx = 1.5 mm) of the 100× optical microscope image of reflection and transmission illumination. The outer rims of the samples are defocused because of the sample radius of curvature. The white line on the image is the scale bar, which is 10 μm. (c,f) have the same illumination and exposure time of 2 s.
Figure 2
Figure 2
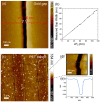
AFM topography of the bent zerogap sample and PET trench after gold removal. (a) shows the gold gap topography of the bent zerogap in 1.8% strain (radius of the curvature is 1.47 cm−1). The width of the gap is 76 nm. The white line is the 100 nm scale bar. The topography depth scale is on the right side of the topography. The strain multiplied period of the sample versus the measured gap size is shown in (b). ε is the strain, and P0 is the period. In this experiment, the period is 5 μm. The y-axis value of the red dot is 2.5 nm [62]. (c) shows the 20 μm × 20 μm size topography zerogap after etching the gold in 1.8% strain (radius of the curvature is 1.47 cm−1). The white spot is expected to be the remaining gold particles. There are periodic nano-trench lines. The white line is the 2 μm scale bar. The topography depth scale is on the right side of the topography. (d) depicts a close-up view of one of the trenches (c). The size of the topography is 500 nm × 500 nm. The nano-trench is located in the center. The white line is the scale bar and the depth scale is on the right side of the topography. (e) is the line profile along the blue dotted line in (d). The line sets the surface of the PET sample as 0 nm.
Figure 3
Figure 3
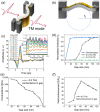
The Terahertz transmission experiments. (a) shows the schematic of Terahertz TM mode transmission experiments. (b) shows the radius of the curvature in the sample center. The dashed line represents the neutral plane, which is the middle point of the plane with zero strain. rc is the sample radius of the curvature and hsub is the sample thickness. The TDS-THz transmission amplitude graph is (c). The results in the frequency domain are presented in the top right inset. The lines are the curvature from 0.00 cm−1 to 1.92 cm−1 and bare PET. (d) shows the comparison of the TM mode simulation, TM mode experiments, and TE mode experiment of 0.5 THz normalized transmission intensity. (e) The RC model conductance graph from the result (d). The terahertz field enhancements are shown in (f).
Figure 4
Figure 4
Visible laser beam diffraction pattern of 532 nm wavelength. (a) Schematic of the 532 nm laser beam diffraction pattern. (b) shows the 532 nm green laser diffraction pattern through the zerogap sample. The TM mode 0th order normalized transmission intensity is shown in (c). The TM mode 1st and 2nd order normalized transmission intensity is shown in (d,e). The TE mode 0th order normalized intensity is shown in (f). The TE mode 1st and 2nd order normalized intensity is shown in (g,h).

References

    1. Lee G., Lee J., Park Q.-H., Seo M. Frontiers in terahertz imaging applications beyond absorption cross-section and diffraction limits. ACS Photonics. 2022;9:1500–1512. doi: 10.1021/acsphotonics.1c02006. - DOI
    1. Valušis G., Lisauskas A., Yuan H., Knap W., Roskos H.G. Roadmap of terahertz imaging 2021. Sensors. 2021;21:4092. doi: 10.3390/s21124092. - DOI - PMC - PubMed
    1. Castro-Camus E., Koch M., Mittleman D.M. Recent advances in terahertz imaging: 1999 to 2021. Appl. Phys. B. 2022;128:12. doi: 10.1007/s00340-021-07732-4. - DOI
    1. Mølvig B.H., Bæk T., Ji J., Bøggild P., Lange S.J., Jepsen P.U. Terahertz Cross-Correlation Spectroscopy and Imaging of Large-Area Graphene. Sensors. 2023;23:3297. doi: 10.3390/s23063297. - DOI - PMC - PubMed
    1. Leitenstorfer A., Moskalenko A.S., Kampfrath T., Kono J., Castro-Camus E., Peng K., Qureshi N., Turchinovich D., Tanaka K., Markelz A.G. The 2023 terahertz science and technology roadmap. J. Phys. D Appl. Phys. 2023;56:223001. doi: 10.1088/1361-6463/acbe4c. - DOI

LinkOut - more resources