Review
. 2023 Sep 18;13(18):2585.
doi: 10.3390/nano13182585.

A Review of the Current State of Magnetic Force Microscopy to Unravel the Magnetic Properties of Nanomaterials Applied in Biological Systems and Future Directions for Quantum Technologies

Affiliations
Review

A Review of the Current State of Magnetic Force Microscopy to Unravel the Magnetic Properties of Nanomaterials Applied in Biological Systems and Future Directions for Quantum Technologies

Robert Winkler et al. Nanomaterials (Basel). .

Abstract

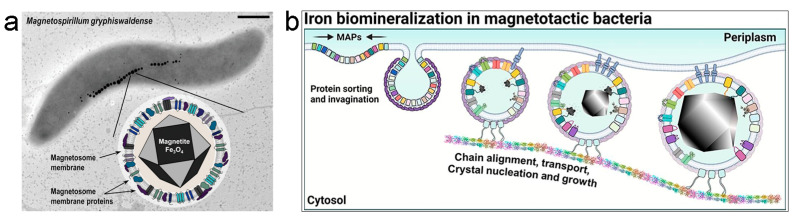
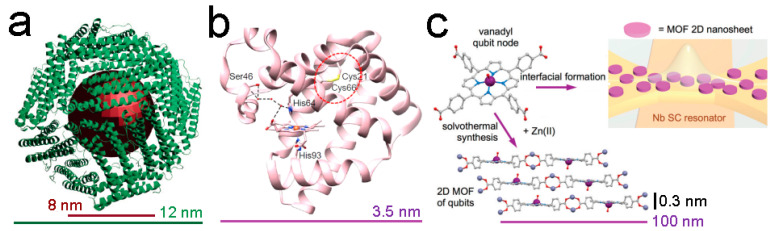
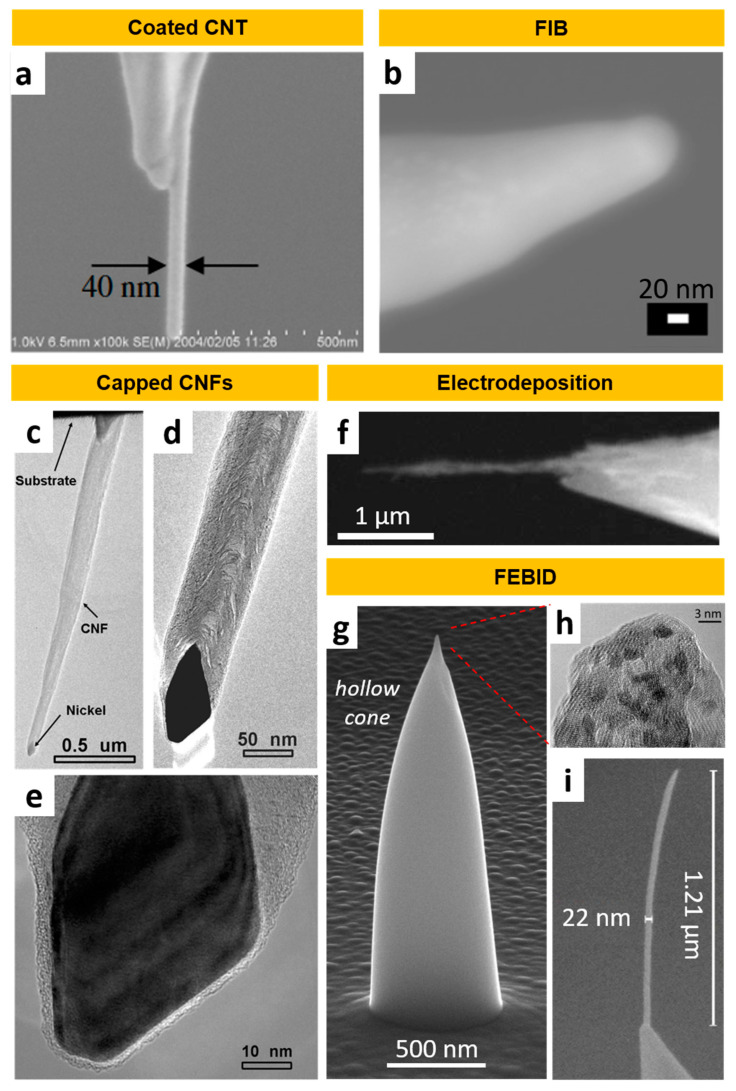
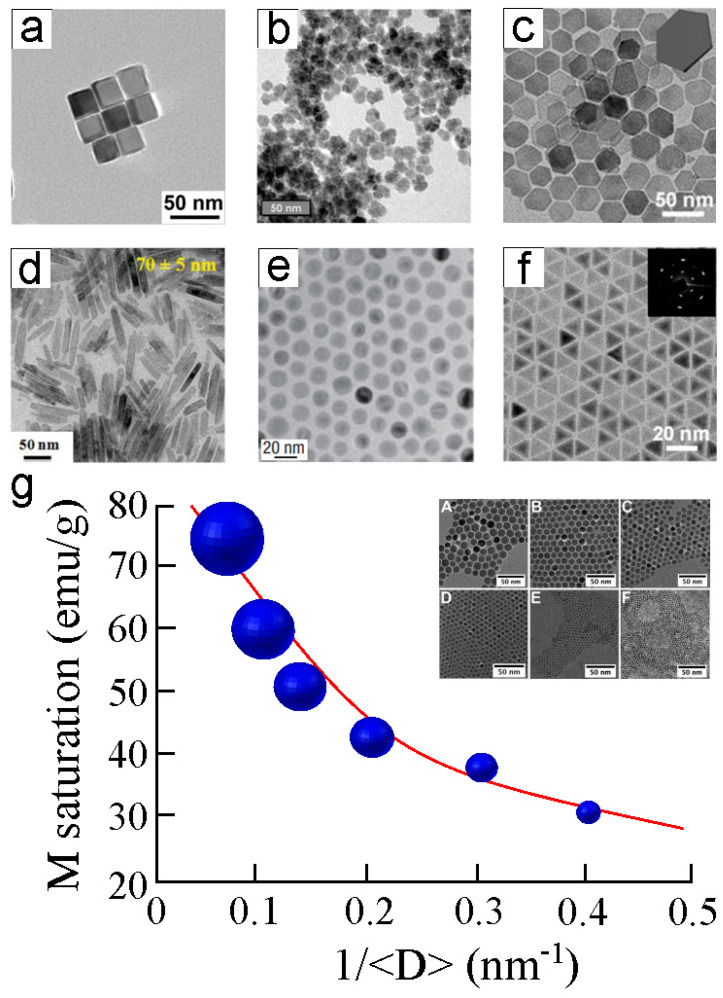
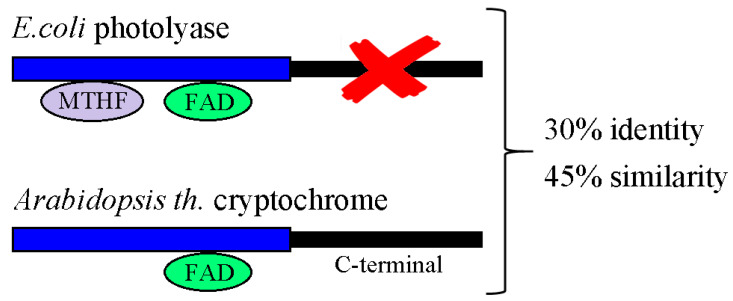
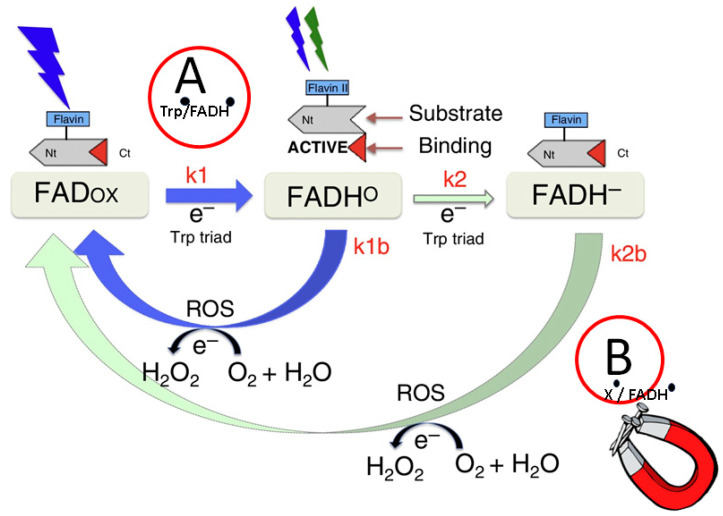
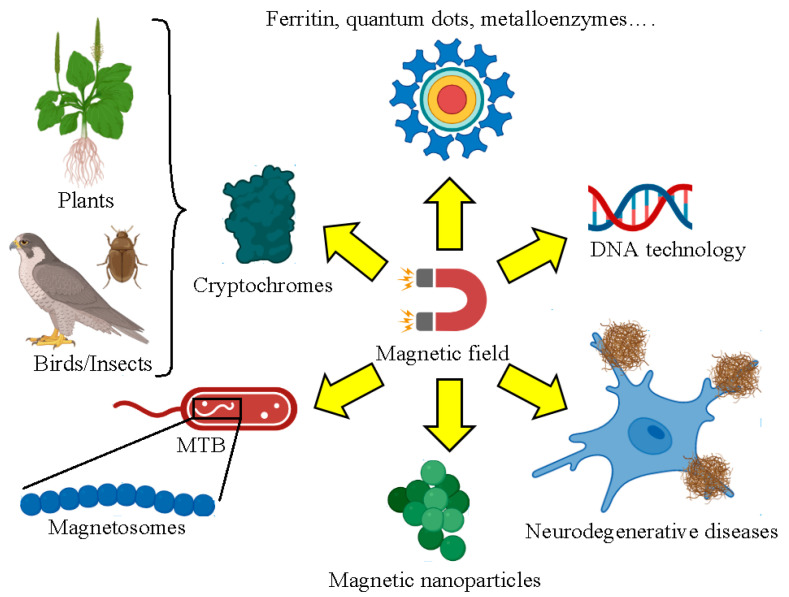
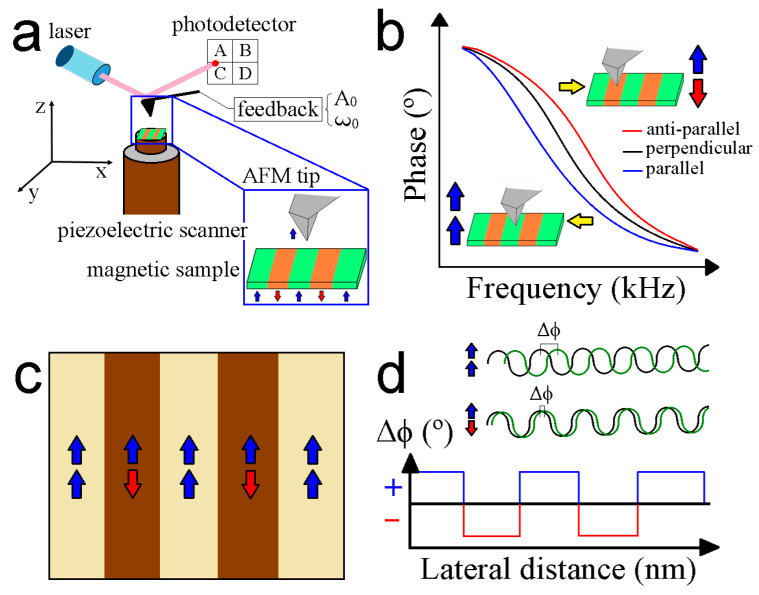
Magnetism plays a pivotal role in many biological systems. However, the intensity of the magnetic forces exerted between magnetic bodies is usually low, which demands the development of ultra-sensitivity tools for proper sensing. In this framework, magnetic force microscopy (MFM) offers excellent lateral resolution and the possibility of conducting single-molecule studies like other single-probe microscopy (SPM) techniques. This comprehensive review attempts to describe the paramount importance of magnetic forces for biological applications by highlighting MFM's main advantages but also intrinsic limitations. While the working principles are described in depth, the article also focuses on novel micro- and nanofabrication procedures for MFM tips, which enhance the magnetic response signal of tested biomaterials compared to commercial nanoprobes. This work also depicts some relevant examples where MFM can quantitatively assess the magnetic performance of nanomaterials involved in biological systems, including magnetotactic bacteria, cryptochrome flavoproteins, and magnetic nanoparticles that can interact with animal tissues. Additionally, the most promising perspectives in this field are highlighted to make the reader aware of upcoming challenges when aiming toward quantum technologies.

Keywords: atomic force microscopy; biological systems; drug delivery; magnetic force microscopy; magnetic properties; magnetic tip fabrication; nanofabrication; quantum technologies; single-molecule studies.


Conflict of interest statement

The authors declare no conflict of interest. The funders had no role in the design of the study; in the collection, analyses, or interpretation of data; in the writing of the manuscript, or in the decision to publish the results.

Figures

Figure 1
Figure 1
(a) Magnetosome formation in M. gryphiswaldense. Scale bar 0.5 µm. Reprinted with permission from [123]. Copyright 2023, Wiley. (b) Suggested model of protein sorting, membrane invagination, and magnetosome assembly into an organized chain. Reprinted with permission from [124]. Copyright 2021, Elsevier.
Figure 5
Figure 5
(a) Schematic representation of ferritin, based on the protein database (PDB) of horse-spleen apoferritin (PDB ID: 2W0O). Reprinted with permission from [217]. Copyright 2022, MDPI. (b) Crystal structure of variant myoglobin (PDB ID: 5ZEO). The hydrogen bonds involving the distal His64 and Ser46 residues with the heme group are shown by black dashed lines. Reprinted with permission from [228]. Copyright 2022, American Chemical Society. (c) Bulk and interfacial formation of the 2D MOF [{VO(TCPP)}-Zn2(H2O2)]. Reprinted with permission from [229]. Copyright 2020, Royal Society of Chemistry.
Figure 9
Figure 9
Examples of ultra-sharp MFM tips, fabricated by advanced fabrication techniques: (a) Carbon nanotube (CNT) after CoFe sputtering. Reprinted from [312]. Copyright 2005, IOPscience. (b) NdFeB needle extracted and sharpened by Focused Ion Beam (FIB) milling. Reprinted from [309]. Copyright 2011, IOPscience. (ce) TEM images at different magnifications of Ni-capped Carbon nanofibers (CNF) grown by direct-current plasma-enhanced chemical vapor deposition. Reprinted from [313]. Copyright 2004, ACS Publications. (f) Ni nanowire synthesized by electrodeposition and attached to a cantilever by dielectrophoresis. Adapted from [314]. Copyright 2005, AIP Publishing. (g) Hollow Co3Fe cone deposited by Focused Electron Beam Induced Deposition (FEBID). Reprinted from [315]. Copyright 2023, MDPI. (h) TEM image of the tip area of a Co3Fe FEBID MFM tip. Reprinted from [315]. Copyright 2023, MDPI. (i) Extremely thin Fe FEBID pillar deposited on an AFM tip. Adapted from [316]. Copyright 2021, MDPI.
Figure 2
Figure 2
TEM images of iron oxide nanoparticles with the following morphologies: (a) Cubic. Reprinted with permission from [137]. Copyright 2020, American Chemical Society. (b) Nanoflower. Reprinted with permission from [138]. Copyright 2022, Nature. (c) Hexagonal. Reprinted with permission from [139]. Copyright 2015, American Chemical Society. (d) Rod-shape. Reprinted with permission from [140]. Copyright 2015, Royal Society of Chemistry. (e) Globular. Reprinted with permission from [141]. Copyright 2004, Nature. (f) Tetrahedron. Reprinted with permission from [139]. Copyright 2015, American Chemical Society. The scale bars are 50 nm and 20 nm for (ad) and (e,f), respectively. (g) Saturation magnetization evolution as a function of iron oxide magnetic nanoparticle diameter at 5 K. The offset corresponds to the TEM images of the tested magnetic nanoparticles (MNP diameters from 14.0 nm to 2.5 nm). Inset subfigures (A–F) are TEM images of MNPs with the tested diameters. Reprinted with permission from [144]. Copyright 2011, Royal Society of Chemistry.
Figure 3
Figure 3
Schematic representation of the domain structure of photolyase and cryptochrome gene families. A comparison between the domain structures of Escherichia coli photolyase and Arabidopsis thaliana cry1 is shown. All classes of cryptochromes and photolyases contain the highly conserved N-terminal domain binding light-abosrbing flavin adenine dinucleotide (FAD). E. coli photolyase in addition binds methenyltetrahydrofolate (MTHF) antenna pigment. By contrast, the C-terminal domain is not found in photolyases and it is poorly conserved displaying variable lengths even among cryptochromes of the same species (e.g., Atcry1 and Atcry2).
Figure 4
Figure 4
The Arabidopsis cryptochrome photocycle. This figure represents a composite consistent with published data. In the dark, cryptochromes are in the inactive state (C-terminal domain folded against the protein, flavin in the oxidized redox state). Upon illumination with blue light (wavelengths below 500 nm), flavin undergoes photoreduction to the FADH° redox form (rate constant k1) by forward electron transfer via the Trp triad pathway [177]. This event triggers conformational change and unfolding of the C-terminal domain to give the activated form of the receptor, which is thereby accessible for signaling partner binding. Subsequent illumination of FADH° with an additional photon of either blue or green light (wavelengths below 600 nm) can induce further reduction to the (FADH) inactive redox form (k2), although at much lower efficiency than k1. Reoxidation to the resting (FADox) state from FADH° occurs spontaneously in the presence of molecular oxygen, with a rate constant (k1b) of several minutes, and is accompanied by the formation of ROS and H2O2. More rapid reoxidation occurs from the FADH redox form to FADox by an alternate pathway involving formation of transient oxygen and flavin radical intermediates [190,191]. Changes in rate constants k2b and k1b would explain the change in biological activity under applied magnetic field conditions. Reprinted with permission from [189]. Copyright 2016, Elsevier.
Figure 6
Figure 6
Biology systems and nanomaterials involved in biology applications affected by external magnetic fields. Images were created using BioRender.com (accessed on 13 March 2023).
Figure 7
Figure 7
(a) Schematic representation of the main components of a typical AFM setup. The laser beam is reflected at the cantilever top surface to a photodetector, which records the cantilever deflection. The cantilever is excited by the feedback chosen depending on the MFM operational mode used. The piezoelectric scanner enables the high positioning precision of the mounted sample with respect to the AFM tip. The zoom inset represents the magnetic moments of the AFM tip and a multi-domain sample. (b) Excitation frequency shifts according to the orientation between the magnetic moments of the AFM tip and the scanned sample. Positive frequency shifts are observed when the magnetic moments are placed in anti-parallel (red line) orientation caused by repulsive magnetic forces. Parallel (blue line) orientation of the tip-sample magnetic moments and the generated attractive magnetic forces induce negative excitation frequency shifts. No changes in the frequency are reported if perpendicular (black line) tip-sample magnetic orientation moments are displayed. (c) MFM channel of the scanned substrate surface where the parallel and anti-parallel tip-sample magnetic orientations correspond to brighter and darker setting colors, respectively. (d) Phase shifts (Δϕ) originated from the magnetic tip-sample interaction. Anti-parallel orientation of the magnetic moments between the AFM tip and the scanned sample surface produces positive Δϕ, whereas the opposite effect takes place for the antagonistic parallel magnetic moment orientation.
Figure 8
Figure 8
Schematic representation of all existing MFM operational modes: (a) Constant height and constant force modes consist of a double pass of the AFM tip close to the sample surface area in static mode. The tip-sample distance and the applied force between the tip and the external sample surface are kept constant for each mode, respectively. Left image represents the phase shift caused by the magnetic contrast (Δϕ) of the scanned sample domains. (b) Lift mode works with a second pass of the AFM tip above to the scanned sample surface. While in the first pass, the tip is close to this surface, during the second pass, the AFM tip is moved away a certain distance (hlift) in dynamic contact mode (AC-mode). The movement of the AFM tip in this second pass corresponds to the previously recorded topography of the scan line in the first pass. (c) Frequency-modulated Kelvin probe microscopy directly observes the difference in the contact potential between the AFM tip and the sample (VDC) by the detected probe resonant peak sidebands induced by the alternative current voltage (AC-V). The detection of Δϕ is similar to the case of lift mode. The positive and negative magnetic domains of the substrate are in green and brown, respectively. (d) Magnetic resonance force microscopy displays a similar configuration to the above described but the tip scans the sample surface with one single pass and setup is coupled with a microwave radio frequency source. The yellow spheroid depicts a non-magnetic feature with conductive potential.
Figure 10
Figure 10
SEM field image of an MFM tip (scale bar of 5 µm). Reprinted with permission from [376]. Copyright 2010, AIP Publishing. Zoomed SEM images of the apex from a commercial and ultra-sharp MFM tips. Scale bar of 100 nm. Reprinted with permissions from [315]. Copyright 2023, MDPI. Commercial and ultra-sharp MFM tips can characterize the magnetic properties of 3D qubits and 2D qubit systems, respectively.

Similar articles

Cited by

References

    1. Lin C., Todo T. The cryptochromes. Genome Biol. 2005;6:220. doi: 10.1186/gb-2005-6-5-220. - DOI - PMC - PubMed
    1. Faivre D., Schüler D. Magnetotactic Bacteria and Magnetosomes. Chem. Rev. 2008;108:4875–4898. doi: 10.1021/cr078258w. - DOI - PubMed
    1. Tenuzzo B., Chionna A., Panzarini E., Lanubile R., Tarantino P., Di Jeso B., Dwikat M., Dini L. Biological effects of 6 mT static magnetic fields: A comparative study in different cell types. Bioelectromagnetics. 2006;27:560–577. doi: 10.1002/bem.20252. - DOI - PubMed
    1. Liboff A.R., Williams T., Jr., Strong D.M., Wistar R., Jr. Time-varying magnetic fields: Effect on DNA synthesis. Science. 1984;223:818–820. doi: 10.1126/science.6695183. - DOI - PubMed
    1. Ritz T., Yoshii T., Helfrich-Foerster C., Ahmad M. Crytochrome: A photoreceptor with the properties of a magnetoreceptor? Commun. Integr. Biol. 2010;3:24–27. doi: 10.4161/cib.3.1.9865. - DOI - PMC - PubMed

LinkOut - more resources