

Meta-Analysis of European Clinical Trials Characterizing the Healthy-Adult Serum 25-hydroxyvitamin D Response to Vitamin D Supplementation
- PMID: 37764770
- PMCID: PMC10537880
- DOI: 10.3390/nu15183986
Meta-Analysis of European Clinical Trials Characterizing the Healthy-Adult Serum 25-hydroxyvitamin D Response to Vitamin D Supplementation
Abstract
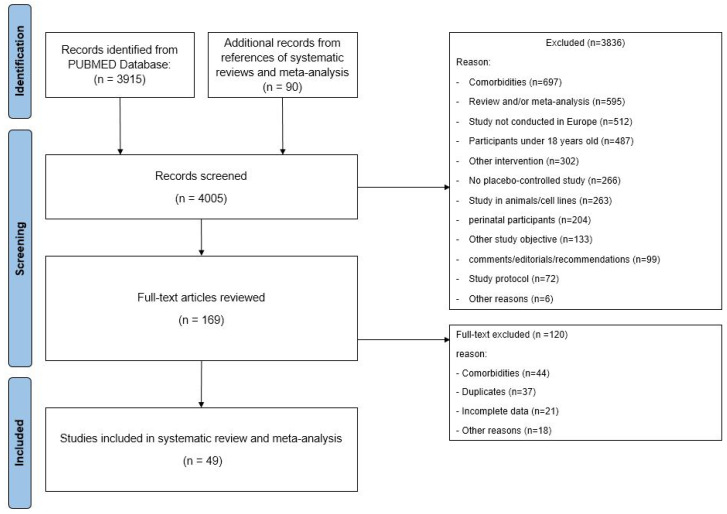
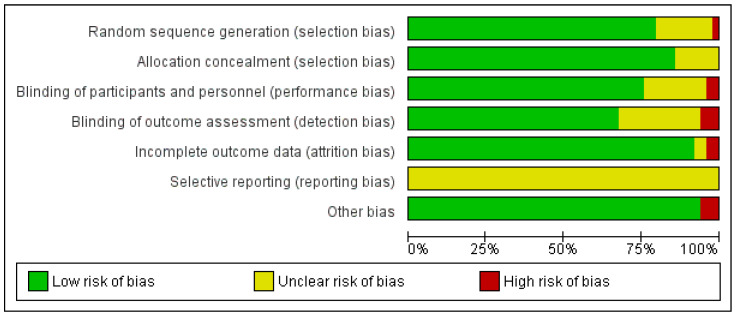
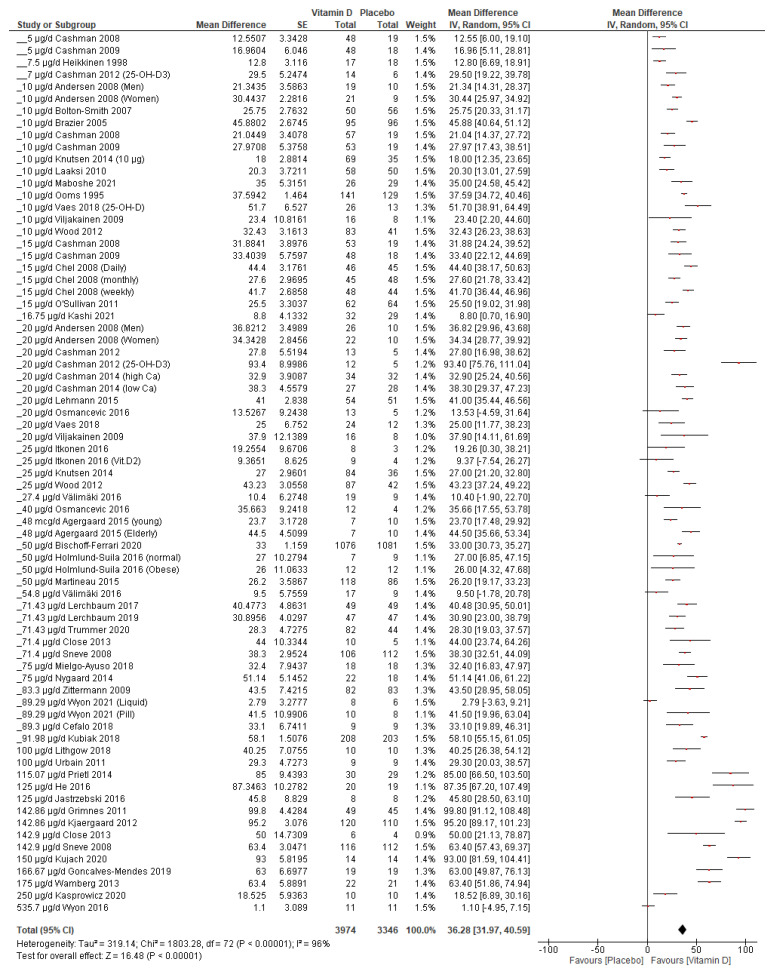
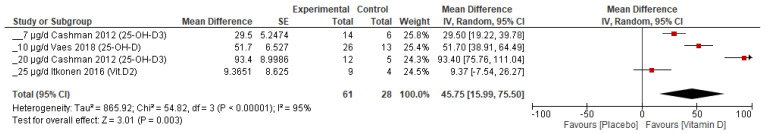
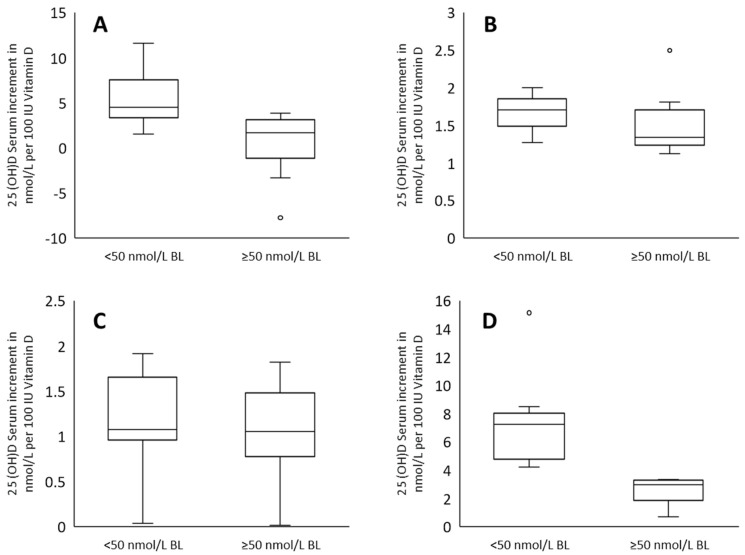
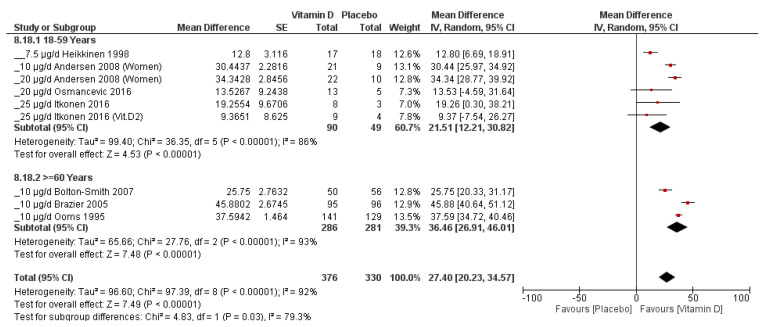
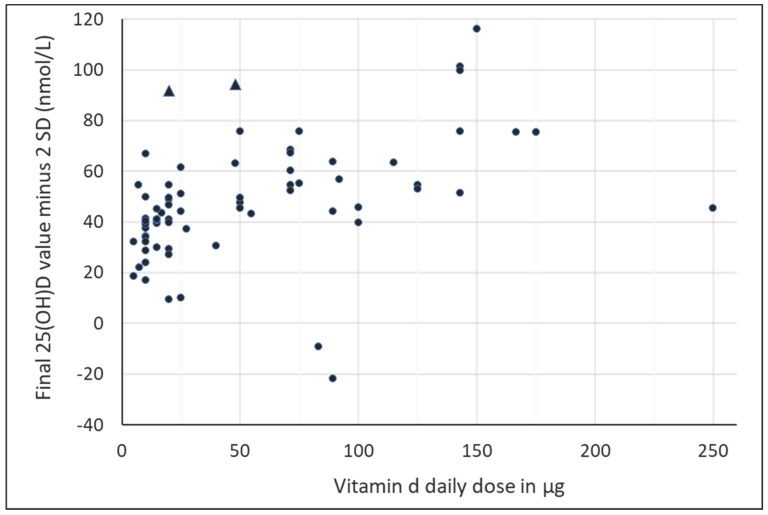
To obtain reliable data that allow health authorities to re-evaluate recommendations for oral vitamin D uptake, we conducted a meta-analysis to investigate the impact of supplementation on serum 25-hydroxyvitamin D (25(OH)D) levels in healthy adults in Europe. Of the publications identified (n = 4005) in our literature search (PUBMED, through 2 January 2022), 49 primary studies (7320 subjects, 73 study arms) were eligible for inclusion in our meta-analysis. The risk of bias was assessed using the Cochrane RoB tool based on seven categories, according to which each study is rated using three grades, and overall was rated as rather low. The median duration of intervention was 136.78 days (range, 1088 days); the mean weighted baseline 25(OH)D concentration and mean age were 33.01 vs. 33.84 nmol/L and 46.8 vs. 44.8 years in the vitamin D and placebo groups, respectively. Using random-effects models, 25(OH)D levels were increased by 36.28 nmol/L (95% CI 31.97-40.59) in the vitamin D group compared to the placebo, with a relative serum increment of 1.77 nmol/L per 2.5 μg of vitamin D daily. Notably, the relative serum 25(OH)D increment was affected by various factors, including the dosage and baseline serum 25(OH)D concentration, decreasing with increasing vitamin D doses and with increasing baseline serum levels. We estimate that supplementation in all healthy adults in Europe with appr. 25 μg of vitamin D (1000 IU) daily would raise serum 25(OH)D levels in 95% of the population to ≥50 nmol/L. Our work provides health authorities with reliable data that can help to re-evaluate recommendations for oral vitamin D supplementation.
Keywords: Europe; adults; healthy; supplementation; vitamin D; vitamin D deficiency.
Conflict of interest statement
The authors declare no conflict of interest.
Figures
Similar articles
-
Vitamin D supplementation to prevent acute respiratory infections: a systematic review and meta-analysis of aggregate data from randomised controlled trials.Lancet Diabetes Endocrinol. 2021 May;9(5):276-292. doi: 10.1016/S2213-8587(21)00051-6. Epub 2021 Mar 30. Lancet Diabetes Endocrinol. 2021. PMID: 33798465
-
Dose-response effects of supplementation with calcifediol on serum 25-hydroxyvitamin D status and its metabolites: A randomized controlled trial in older adults.Clin Nutr. 2018 Jun;37(3):808-814. doi: 10.1016/j.clnu.2017.03.029. Epub 2017 Mar 31. Clin Nutr. 2018. PMID: 28433267 Clinical Trial.
-
Daily supplementation with 15 μg vitamin D2 compared with vitamin D3 to increase wintertime 25-hydroxyvitamin D status in healthy South Asian and white European women: a 12-wk randomized, placebo-controlled food-fortification trial.Am J Clin Nutr. 2017 Aug;106(2):481-490. doi: 10.3945/ajcn.116.138693. Epub 2017 Jul 5. Am J Clin Nutr. 2017. PMID: 28679555 Clinical Trial.
-
The importance of body weight for the dose response relationship of oral vitamin D supplementation and serum 25-hydroxyvitamin D in healthy volunteers.PLoS One. 2014 Nov 5;9(11):e111265. doi: 10.1371/journal.pone.0111265. eCollection 2014. PLoS One. 2014. PMID: 25372709 Free PMC article.
-
Serum 25(OH)D response to vitamin D3 supplementation: a meta-regression analysis.Nutrition. 2014 Sep;30(9):975-85. doi: 10.1016/j.nut.2013.12.020. Epub 2014 Jan 10. Nutrition. 2014. PMID: 24993750 Review.
Cited by
-
The relationships of serum vitamin D concentration with linear speed and change of direction performance in soccer players.Front Nutr. 2024 Nov 22;11:1501643. doi: 10.3389/fnut.2024.1501643. eCollection 2024. Front Nutr. 2024. PMID: 39650712 Free PMC article.
-
Effect of a plant extract of fenugreek (Trigonella foenum-graecum) on testosterone in blood plasma and saliva in a double blind randomized controlled intervention study.PLoS One. 2024 Sep 17;19(9):e0310170. doi: 10.1371/journal.pone.0310170. eCollection 2024. PLoS One. 2024. PMID: 39288153 Free PMC article. Clinical Trial.
-
Vitamin D beyond the blood: Tissue distribution of vitamin D metabolites after supplementation.Life Sci. 2024 Oct 15;355:122942. doi: 10.1016/j.lfs.2024.122942. Epub 2024 Aug 10. Life Sci. 2024. PMID: 39134205 Review.
-
Prevalence and Progression of Vitamin D Deficiency in Greater Beirut and Mount Lebanon From 2013 to 2022: An Analysis of 19,452 Adults.J Clin Lab Anal. 2025 Apr;39(8):e70023. doi: 10.1002/jcla.70023. Epub 2025 Mar 28. J Clin Lab Anal. 2025. PMID: 40152347 Free PMC article.
-
Vitamin D Levels in Patients Presenting to a Rheumatology Clinic in Germany: Associations with Patient Characteristics and Season.Nutrients. 2025 May 31;17(11):1893. doi: 10.3390/nu17111893. Nutrients. 2025. PMID: 40507162 Free PMC article.
References
-
- Reichrath J. Sonne—Die Dosis macht’s! Hautkrebs Vermeiden Vitam.-D-Mangel Vorbeug. 2021
Publication types
MeSH terms
Substances
LinkOut - more resources
Full Text Sources
Medical
