

Influence of Body Composition and Specific Anthropometric Parameters on SIBO Type
- PMID: 37764818
- PMCID: PMC10535553
- DOI: 10.3390/nu15184035
Influence of Body Composition and Specific Anthropometric Parameters on SIBO Type
Abstract
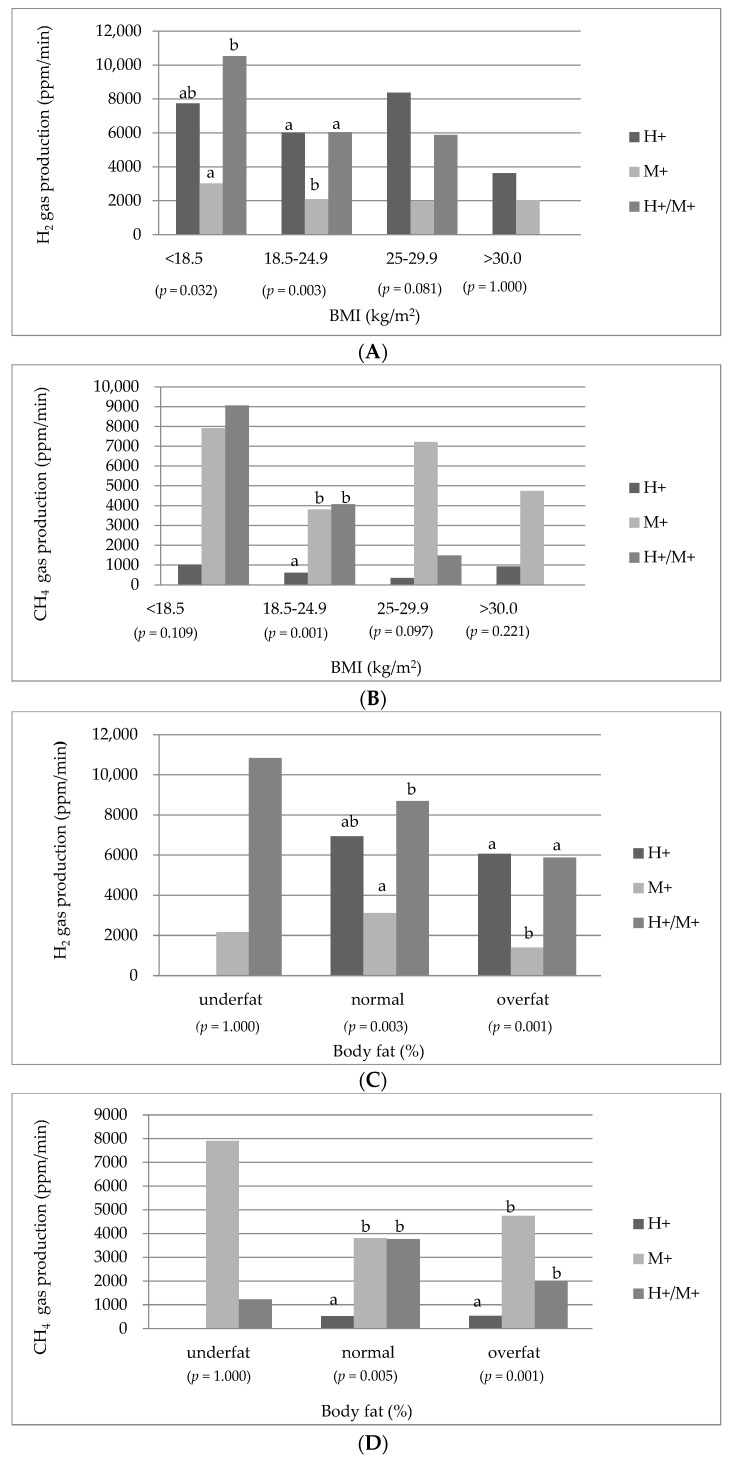
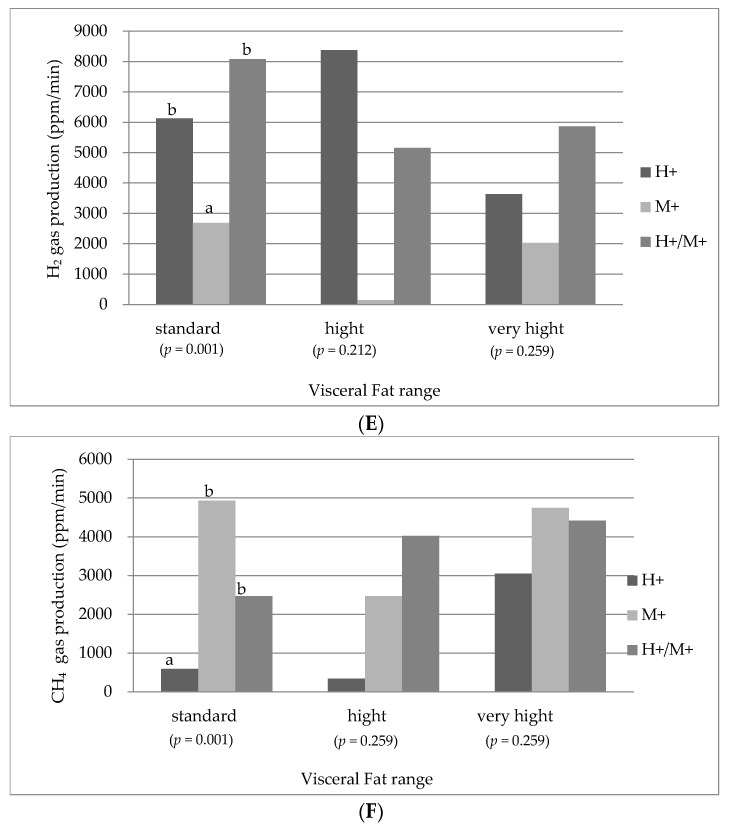
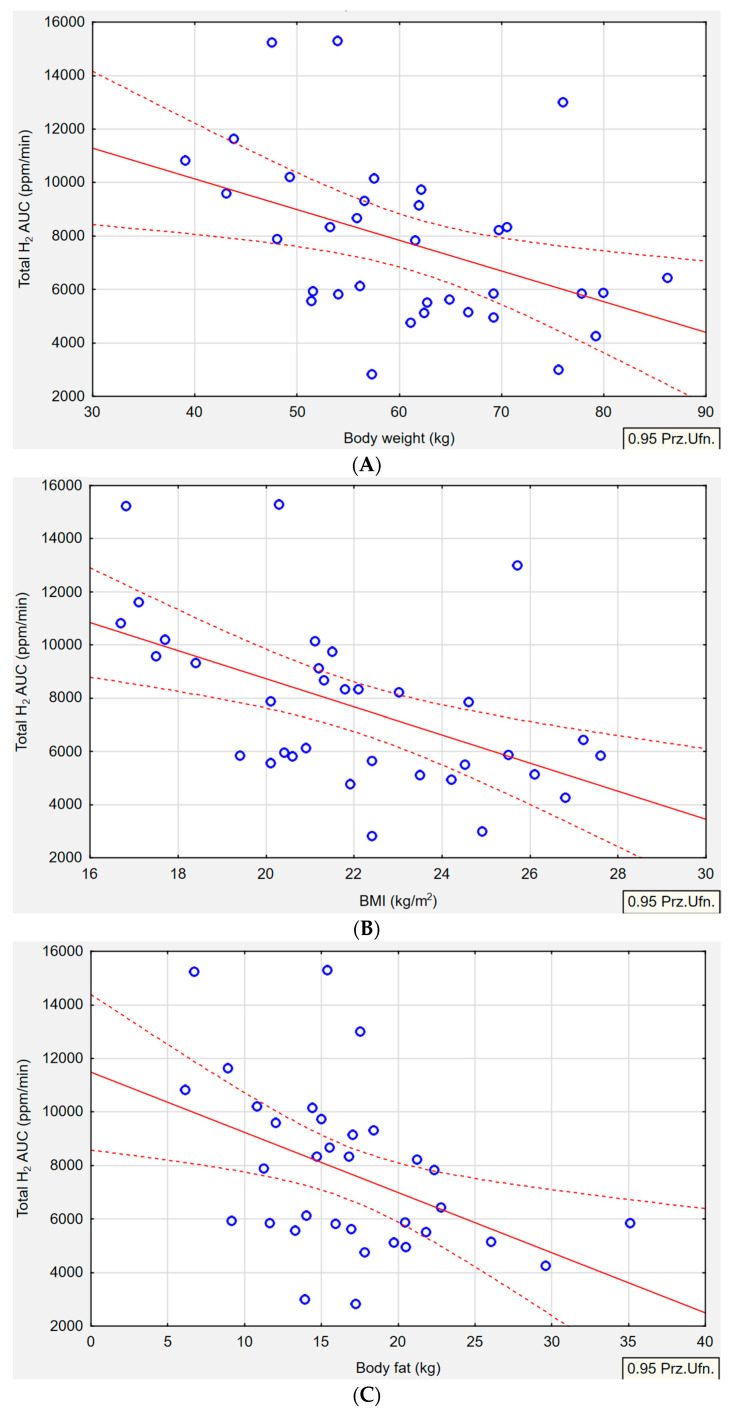
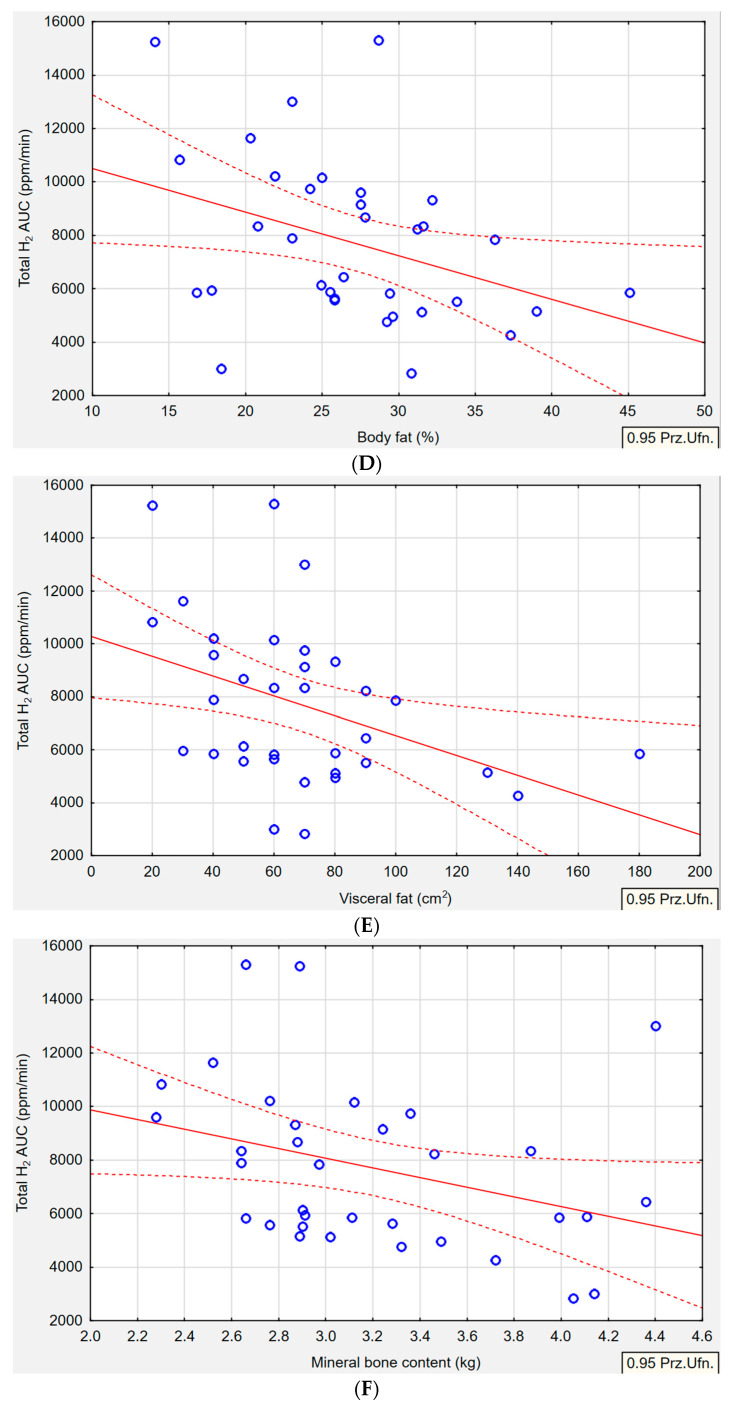
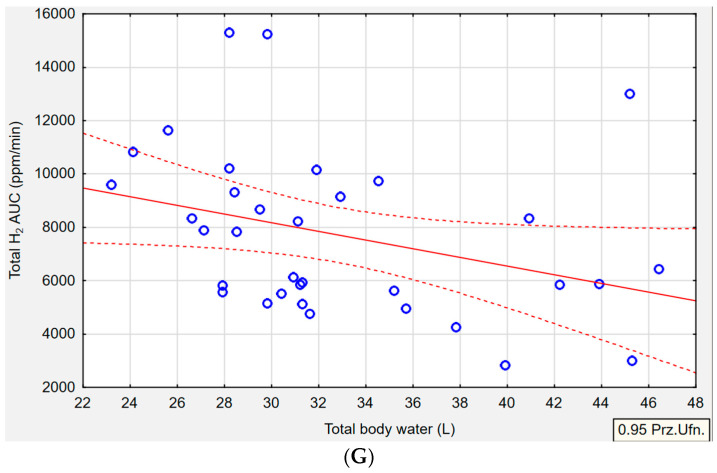
Recent observations have shown that Small Intestinal Bacterial Overgrowth (SIBO)affects the host through various mechanisms. While both weight loss and obesity have been reported in the SIBO population due to alterations in the gut microbiome, very little is known about the influence of SIBO type on body composition. This study aimed to evaluate whether there is a link between the three types of SIBO: methane dominant (M+), hydrogen dominant (H+), and methane-hydrogen dominant (H+/M+) and specific anthropometric parameters. This observational study included 67 participants (W = 53, M = 14) with gastrointestinal symptoms and SIBO confirmed by lactulose hydrogen-methane breath tests (LHMBTs) using the QuinTron device. Participants underwent a body composition assessment by Bioelectrical Impedance Analysis (BIA) using the InBody Analyzer. In the H+/M+ group, body weight (p = 0.010), BMI (p = 0.001), body fat in kg (p = 0.009), body fat in % (p = 0.040), visceral fat (p = 0.002), and mineral bone content (p = 0.049) showed an inverse correlation with hydrogen (H2) gas production. These findings suggest that body weight, BMI, body fat, and mineral bone content may be inversely linked to the production of hydrogen and the risk of hydrogen-methane SIBO.
Keywords: BMI; SIBO; body composition; body fat; breath test; dysbiosis; gut; hydrogen–methane.
Conflict of interest statement
The authors declare no conflict of interest.
Figures
Similar articles
-
[Clinical features of irritable bowel syndrome with small intestinal bacterial overgrowth and a preliminary study of effectiveness of Rifaximin].Zhonghua Yi Xue Za Zhi. 2016 Jun 28;96(24):1896-902. doi: 10.3760/cma.j.issn.0376-2491.2016.24.005. Zhonghua Yi Xue Za Zhi. 2016. PMID: 27373356 Chinese.
-
Elevated methane levels in small intestinal bacterial overgrowth suggests delayed small bowel and colonic transit.Medicine (Baltimore). 2018 May;97(21):e10554. doi: 10.1097/MD.0000000000010554. Medicine (Baltimore). 2018. PMID: 29794732 Free PMC article.
-
Correlation Between Gastroesophageal Reflux Disease and Small Intestinal Bacterial Overgrowth: Analysis of Intestinal Microbiome and Metabolic Characteristics.J Inflamm Res. 2025 Jan 4;18:33-51. doi: 10.2147/JIR.S487185. eCollection 2025. J Inflamm Res. 2025. PMID: 39780983 Free PMC article.
-
Breath testing for small intestinal bacterial overgrowth: maximizing test accuracy.Clin Gastroenterol Hepatol. 2014 Dec;12(12):1964-72; quiz e119-20. doi: 10.1016/j.cgh.2013.09.055. Epub 2013 Oct 1. Clin Gastroenterol Hepatol. 2014. PMID: 24095975 Review.
-
Small Intestinal Bacterial Overgrowth and Irritable Bowel Syndrome - An Update.Front Psychiatry. 2020 Jul 10;11:664. doi: 10.3389/fpsyt.2020.00664. eCollection 2020. Front Psychiatry. 2020. PMID: 32754068 Free PMC article. Review.
Cited by
-
Small intestinal bacterial overgrowth and metabolic dysfunction-associated steatotic liver disease.Front Nutr. 2024 Dec 17;11:1502151. doi: 10.3389/fnut.2024.1502151. eCollection 2024. Front Nutr. 2024. PMID: 39742106 Free PMC article.
-
Hydrogen and Methane Detection in Breath in Response to Two Different Types of Dietary Fiber and Its Relationship to Postprandial Glucose Concentration in Obese Patients with Type 2 Diabetes and Normoglycemic Subjects.Nutrients. 2025 Mar 6;17(5):917. doi: 10.3390/nu17050917. Nutrients. 2025. PMID: 40077785 Free PMC article.
-
An Oral Botanical Supplement Improves Small Intestinal Bacterial Overgrowth (SIBO) and Facial Redness: Results of an Open-Label Clinical Study.Nutrients. 2024 Sep 18;16(18):3149. doi: 10.3390/nu16183149. Nutrients. 2024. PMID: 39339748 Free PMC article. Clinical Trial.
-
Identification of SIBO Subtypes along with Nutritional Status and Diet as Key Elements of SIBO Therapy.Int J Mol Sci. 2024 Jul 4;25(13):7341. doi: 10.3390/ijms25137341. Int J Mol Sci. 2024. PMID: 39000446 Free PMC article.
-
A Comprehensive Review of the Usefulness of Prebiotics, Probiotics, and Postbiotics in the Diagnosis and Treatment of Small Intestine Bacterial Overgrowth.Microorganisms. 2025 Jan 1;13(1):57. doi: 10.3390/microorganisms13010057. Microorganisms. 2025. PMID: 39858825 Free PMC article. Review.
References
LinkOut - more resources
Full Text Sources
