

Effect of Artificial Liver Support Systems on Gut Microbiota in Patients with HBV-Related Acute-on-Chronic Liver Failure
- PMID: 37764902
- PMCID: PMC10534758
- DOI: 10.3390/pathogens12091094
Effect of Artificial Liver Support Systems on Gut Microbiota in Patients with HBV-Related Acute-on-Chronic Liver Failure
Abstract
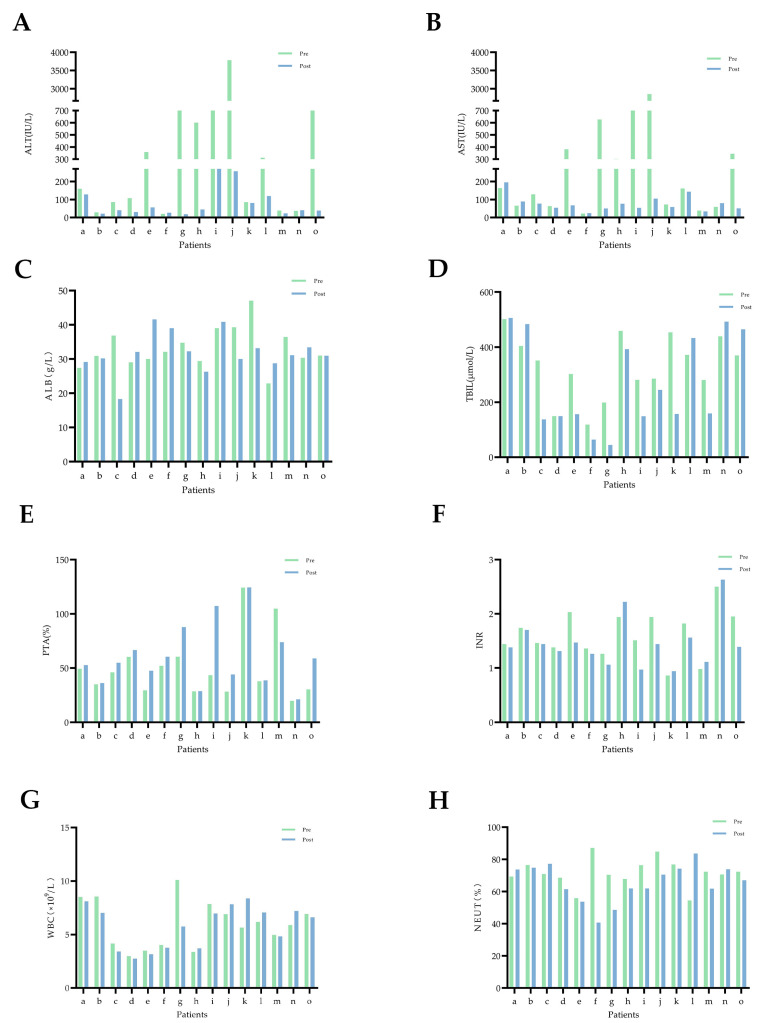
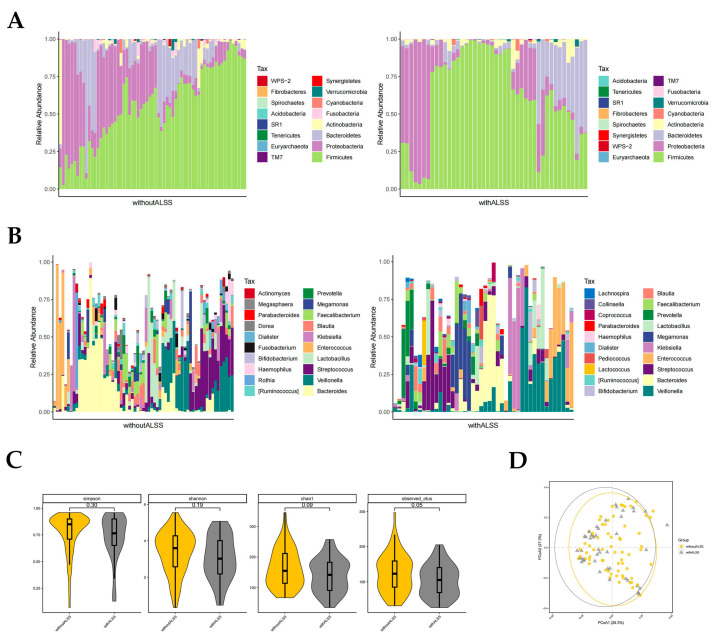
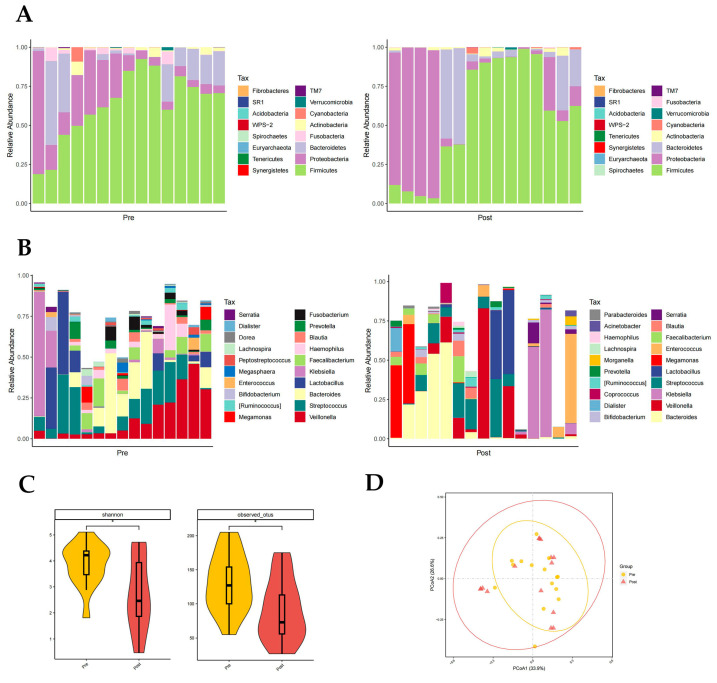
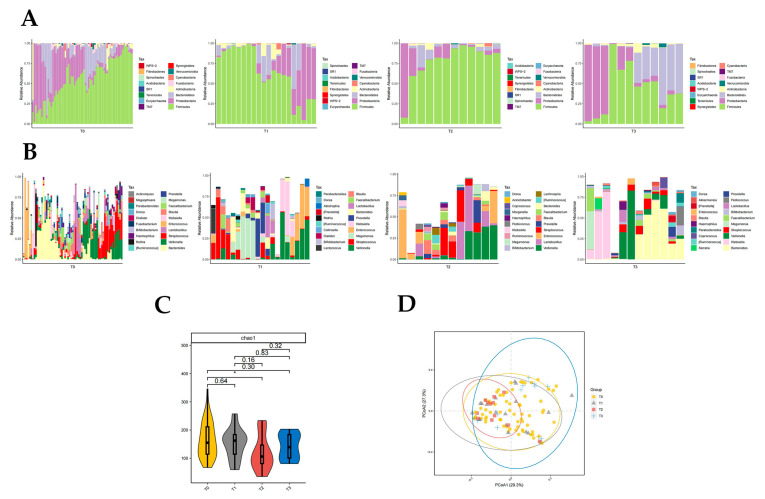
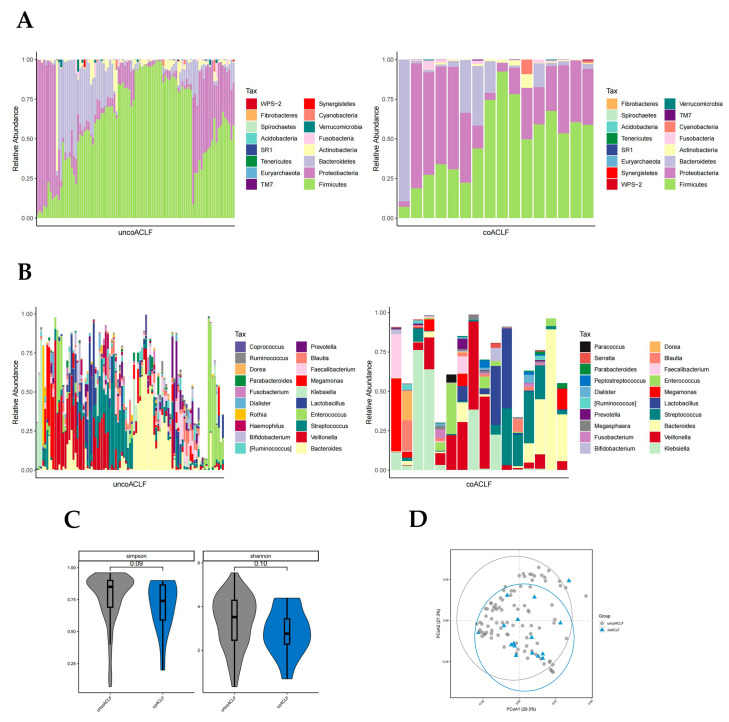
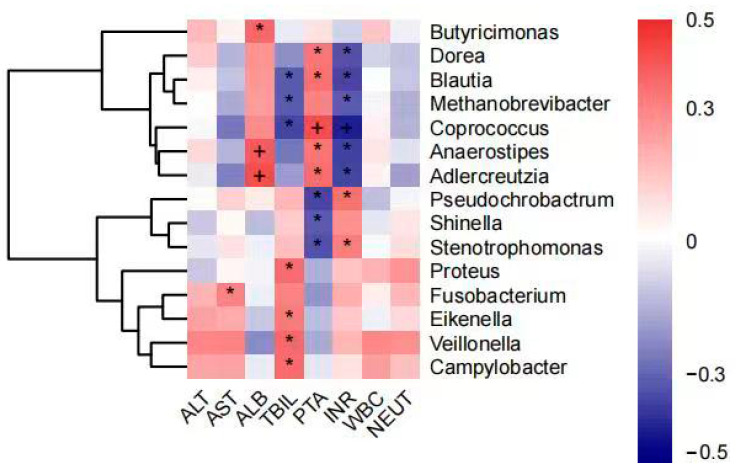
Hepatitis B virus-related acute-on-chronic liver failure (HBV-ACLF) is a rare and severe form of end-stage liver disease with high mortality; gut microbes are strongly associated with the development of this severe liver disease but the exact association is unclear. Artificial liver support systems (ALSS) are clinically important in prolonging the waiting time for liver transplantation and in aiding drug therapy to achieve remission. The aim of this study was to investigate the effect of ALSS on the abundance and diversity of microorganisms in the gut of HBV-ACLF patients. In this study, 109 stool samples were collected from patients with hepatitis B virus-associated acute chronic liver failure (HBV-ACLF) for 16S rRNA sequencing. Among them, 44 samples were from patients treated with ALSS therapy as an adjunct to standard medical treatment (SMT) and 65 were from patients receiving SMT only. Analysis of the sequencing results suggested that there were significant differences in the abundance and diversity of gut microbiota between the with-ALSS and without-ALSS groups (p < 0.05). The operational taxonomic units and Shannon indexes indicated that the diversity and abundance of the gut microbiome, while decreasing after the first ALSS treatment, gradually increased after an increase in the number of ALSS therapies. The overall proportion of HBV-ACLF patients with coinfection was 27.59%; the coinfection can reduce the abundance of the Bacteroidetes phylum in the microbiome significantly whereas Proteobacteria were highly enriched. After ALSS therapy, HBV-ACLF patients had a decrease in potentially harmful bacteria, an increase in potentially beneficial bacteria, an increase in the diversity of the intestinal microbiota, and the intestinal microecological disorders were corrected to a certain extent. Serum alanine aminotransferase (ALT), aspartate aminotransferase (AST), and total bilirubin (TBIL) levels, as well as the international normalized ratio (INR), showed a decreasing trend whereas plasminogen activity (PTA) increased and the condition of patients with HBV-ACLF progressed in a favorable direction. In addition, the abundance of Blautia and Coprococcus was negatively correlated with TBIL and INR, positively correlated with PTA, and positively correlated with disease recovery. Our study shows that ALSS can alter the composition of the gut microbiota and have an ameliorating effect on the gut microecological imbalance in HBV-ACLF patients. It is worth mentioning that Blautia and Coprococcus may have great potential as biomarkers.
Keywords: acute-on-chronic liver failure; artificial liver support system; blood biochemical indicators; gut microbiota; hepatitis B virus.
Conflict of interest statement
The authors declare no conflict of interest.
Figures
Similar articles
-
Impact of the Gut Microbiome on the Progression of Hepatitis B Virus Related Acute-on-Chronic Liver Failure.Front Cell Infect Microbiol. 2021 Apr 6;11:573923. doi: 10.3389/fcimb.2021.573923. eCollection 2021. Front Cell Infect Microbiol. 2021. PMID: 33889550 Free PMC article.
-
Effect of artificial liver support system on short-term prognosis of patients with hepatitis B virus-related acute-on-chronic liver failure.Artif Organs. 2020 Oct;44(10):E434-E447. doi: 10.1111/aor.13710. Epub 2020 May 12. Artif Organs. 2020. PMID: 32320491 Clinical Trial.
-
Artificial Liver Support System Improves Short-Term Outcomes of Patients with HBV-Associated Acute-on-Chronic Liver Failure: A Propensity Score Analysis.Biomed Res Int. 2019 Nov 29;2019:3757149. doi: 10.1155/2019/3757149. eCollection 2019. Biomed Res Int. 2019. PMID: 31871940 Free PMC article.
-
Artificial liver support systems for hepatitis B virus-associated acute-on-chronic liver failure: A meta-analysis of the clinical literature.J Viral Hepat. 2023 Feb;30(2):90-100. doi: 10.1111/jvh.13767. Epub 2022 Nov 18. J Viral Hepat. 2023. PMID: 36327289
-
Survival Benefits With Artificial Liver Support System for Acute-on-Chronic Liver Failure: A Time Series-Based Meta-Analysis.Medicine (Baltimore). 2016 Jan;95(3):e2506. doi: 10.1097/MD.0000000000002506. Medicine (Baltimore). 2016. PMID: 26817889 Free PMC article. Review.
Cited by
-
Association Between Artificial Liver Support System and Prognosis in Hepatitis B Virus-Related Acute-on-Chronic Liver Failure.Infect Drug Resist. 2025 Jan 6;18:113-126. doi: 10.2147/IDR.S500291. eCollection 2025. Infect Drug Resist. 2025. PMID: 39803304 Free PMC article.
-
The impact of artificial liver support system on intestinal microbiota and serum bile acid profiles in patients with acute-on-chronic liver failure: a prospective cohort study.Hepatol Int. 2024 Oct;18(5):1540-1554. doi: 10.1007/s12072-024-10712-3. Epub 2024 Jul 20. Hepatol Int. 2024. PMID: 39031319
References
-
- Sarin S.K., Choudhury A., Sharma M.K., Maiwall R., Al Mahtab M., Rahman S., Saigal S., Saraf N., Soin A.S., Devarbhavi H., et al. Acute-on-chronic liver failure: Consensus recommendations of the Asian Pacific association for the study of the liver (APASL): An update. Hepatol. Int. 2019;13:353–390. doi: 10.1007/s12072-019-09946-3. - DOI - PMC - PubMed
Grants and funding
LinkOut - more resources
Full Text Sources
