. 2023 Sep 19;12(9):1173.
doi: 10.3390/pathogens12091173.

Characterization of Bovine Intraepithelial T Lymphocytes in the Gut

Affiliations

Characterization of Bovine Intraepithelial T Lymphocytes in the Gut

Akanksha Hada et al. Pathogens. .

Abstract

Intraepithelial T lymphocytes (T-IELs), which constitute over 50% of the total T lymphocytes in the animal, patrol the mucosal epithelial lining to defend against pathogen invasion while maintaining gut homeostasis. In addition to expressing T cell markers such as CD4 and CD8, T-IELs display T cell receptors (TCR), including either TCRαβ or TCRγδ. Both humans and mice share similar T-IEL subsets: TCRγδ+, TCRαβ+CD8αα+, TCRαβ+CD4+, and TCRαβ+CD8αβ+. Among these subsets, human T-IELs are predominantly TCRαβ+ (over 80%), whereas those in mice are mostly TCRγδ+ (~60%). Of note, the majority of the TCRγδ+ subset expresses CD8αα in both species. Although T-IELs have been extensively studied in humans and mice, their profiles in cattle have not been well examined. Our study is the first to characterize bovine T-IELs using flow cytometry, where we identified several distinct features. The percentage of TCRγδ+ was comparable to that of TCRαβ+ T-IELs (both ~50% of CD3+), and the majority of bovine TCRγδ+ T-IELs did not express CD8 (CD8-) (above 60%). Furthermore, about 20% of TCRαβ+ T-IELs were CD4+CD8αβ+, and the remaining TCRαβ+ T-IELs were evenly distributed between CD4+ and CD8αβ+ (~40% of TCRαβ+ T-IELs each) with no TCRαβ+CD8αα+ identified. Despite these unique properties, bovine T-IELs, similar to those in humans and mice, expressed a high level of CD69, an activation and tissue-retention marker, and a low level of CD62L, a lymphoid adhesion marker. Moreover, bovine T-IELs produced low levels of inflammatory cytokines such as IFNγ and IL17A, and secreted small amounts of the immune regulatory cytokine TGFβ1. Hence, bovine T-IELs' composition largely differs from that of human and mouse, with the dominance of the CD8- population among TCRγδ+ T-IELs, the substantial presence of TCRαβ+CD4+CD8αβ+ cells, and the absence of TCRαβ+CD8αα+ T-IELs. These results provide the groundwork for conducting future studies to examine how bovine T-IELs respond to intestinal pathogens and maintain the integrity of the gut epithelial barrier in animals.

Keywords: CD4; CD8; IFNγ; IL17A; T-IELs; TCRαβ; TCRγδ; TGFβ1; cattle; intraepithelial T lymphocytes.


Conflict of interest statement

The authors declare no conflict of interest.

Figures

Figure 1
Figure 1
Similar levels of TCRγδ+ and TCRαβ+ T cells in bovine T-IELs. ABM, JJM, ILM, blood, and inguinal lymph node (IGLN) were harvested from finished steers as described in our previous report [32]. ABM: abomasal mucosa. ILM: ileum mucosa. JJM: jejunum mucosa. PBMC: peripheral blood mononuclear cells. A-B: T-IELs collected from the interface (A), and comparison of their yield per unit (B): ABM (~100 g), ILM and JJM (both 10 cm in length), PBMC (10 mL of blood), and IGLN (~2 g). (C) Gating strategies: CD3+ cells were gated based on single lymphocytes, which were further separated into TCRγδ+ and TCRγδ, representing TCRγδ+ and TCRαβ+ T cells. The TCRαβ+ (TCRγδ) population was further analyzed for CD4+ and CD8α+. D-E. Comparison of T cells (CD3+) in isolated T-IELs (D), and TCRγδ+ and TCRαβ+ T cells in T-IELs, PBMC, and IGLN (E). The data were presented as the mean of the individual cattle plus the standard error. This data presentation will be the same in the rest of the figures. All data passed the Anderson–Darling normality test and were analyzed using one-way ANOVA with Tukey’s Multiple Comparisons. Asterisks indicate statistical significance. * p < 0.05; ** p < 0.01; **** p < 0.0001. “NS” indicates not significant. This statistical analysis and these indications will be applied throughout the rest of this manuscript.
Figure 2
Figure 2
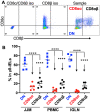
TCRγδ+ T cells are dominantly CD8-negative in T-IELs. (A) Gating strategies for CD8α+ and CD8β+ expression in TCRγδ+ T cells are based on CD3+ as indicated in Figure 1C. DN: double negative for CD8α and CD8β. CD8α+ and CD8β were defined as CD8αα+, according to previous reports [137,138]. Iso: isotype antibody control. (B) Comparison of CD8α+ and CD8β+ expression in TCRγδ+ T cells from different tissues. Each population (CD8αα and CD8αβ) was indicated in the dot plot for the “Sample” in panel A. **** p < 0.0001.
Figure 3
Figure 3
TCRαβ+CD4+CD8αβ+ T cells are substantial in the T-IEL population but not in the blood and lymph nodes. TCRαβ+ were based on CD3+ and TCRγδ as indicated in Figure 1C. (A) Representative dot plots and gating strategies for CD4+ and CD8+ analysis based on TCRαβ+. CD8+ was indicated via CD8α staining. (B) Comparison of subpopulations based on TCRαβ+CD4+ or TCRαβ+CD8+ in total CD3+ lymphocytes. (C) Representative dot plots of CD8α and CD8β expression in CD4+/CD8+ TCRαβ+ T-IELs in (B). * p < 0.05; ** p < 0.01. “NS” indicates not significant.
Figure 4
Figure 4
CD69 and CD62L are differentially expressed in T-IELs compared to T cells in PBMC and lymph nodes. TCRαβ+CD8+ and TCRαβ+CD4+ T cells were based on CD3+ and TCRγδ as indicated in Figure 1C. (A) Gating strategies for CD69 and CD62L expression. B-C: comparison of CD69 (B) or CD62L (C) expression on subpopulation TCRγδ+, TCRαβ+CD8+, and TCRαβ+CD4+ T cells in T-IELs, PBMC, and IGLN. * p < 0.05; ** p < 0.01; *** p < 0.001; **** p < 0.0001.
Figure 5
Figure 5
T-IELs are able to produce cytokines. Single-cell suspensions from different tissues were incubated for 4 h with an activation cocktail [121] before staining for IFNγ (B) and IL17A (C) or TGFβ1 (G). (AC) Gating (A) and comparison of IFNγ (B) and IL17A (C) production in TCRαβ+ T cells (CD4+ or CD8+) and TCRγδ+ T cells as indicated in Figure 1C. Iso: Isotype antibody control. (D) Gating strategy for TGFβ1 expression based on TCRαβ+CD4+ T-IELs. (E) Direct staining for TGFβ1 in fresh samples without further stimulation. (F) Comparison of TGFβ1 expression in samples after stimulation as in (AC). CON: no stimulation control in culture. STIM: stimulated. Colors indicate tissues in (B,C,E,F). * p < 0.05; ** p < 0.01; *** p < 0.001. “NS” indicates not significant.

Similar articles

Cited by

References

    1. Olivares-Villagómez D., Van Kaer L. Intestinal intraepithelial lymphocytes: Sentinels of the mucosal barrier. Trends Immunol. 2018;39:264–275. doi: 10.1016/j.it.2017.11.003. - DOI - PMC - PubMed
    1. Ma H., Qiu Y., Yang H. Intestinal intraepithelial lymphocytes: Maintainers of intestinal immune tolerance and regulators of intestinal immunity. J. Leukoc. Biol. 2021;109:339–347. doi: 10.1002/JLB.3RU0220-111. - DOI - PMC - PubMed
    1. Edelblum K.L., Singh G., Odenwald M.A., Lingaraju A., El Bissati K., Mcleod R., Sperling A.I., Turner J.R. γδ intraepithelial lymphocyte migration limits transepithelial pathogen invasion and systemic disease in mice. Gastroenterology. 2015;148:1417–1426. doi: 10.1053/j.gastro.2015.02.053. - DOI - PMC - PubMed
    1. Ismail A.S., Severson K.M., Vaishnava S., Behrendt C.L., Yu X., Benjamin J.L., Ruhn K.A., Hou B., Defranco A.L., Yarovinsky F., et al. γδ intraepithelial lymphocytes are essential mediators of host–microbial homeostasis at the intestinal mucosal surface. Proc. Natl. Acad. Sci. USA. 2011;108:8743–8748. doi: 10.1073/pnas.1019574108. - DOI - PMC - PubMed
    1. Ismail A.S., Behrendt C.L., Hooper L.V. Reciprocal interactions between commensal bacteria and gamma delta intraepithelial lymphocytes during mucosal injury. J. Immunol. 2009;182:3047–3054. doi: 10.4049/jimmunol.0802705. - DOI - PMC - PubMed