. 2023 Sep 7;23(18):7724.
doi: 10.3390/s23187724.

IRv2-Net: A Deep Learning Framework for Enhanced Polyp Segmentation Performance Integrating InceptionResNetV2 and UNet Architecture with Test Time Augmentation Techniques

Affiliations

IRv2-Net: A Deep Learning Framework for Enhanced Polyp Segmentation Performance Integrating InceptionResNetV2 and UNet Architecture with Test Time Augmentation Techniques

Md Faysal Ahamed et al. Sensors (Basel). .

Abstract

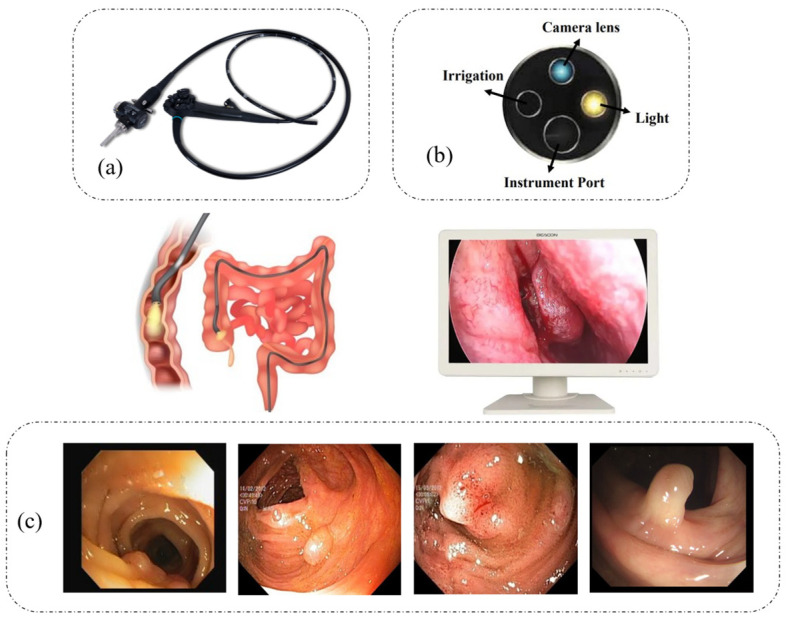
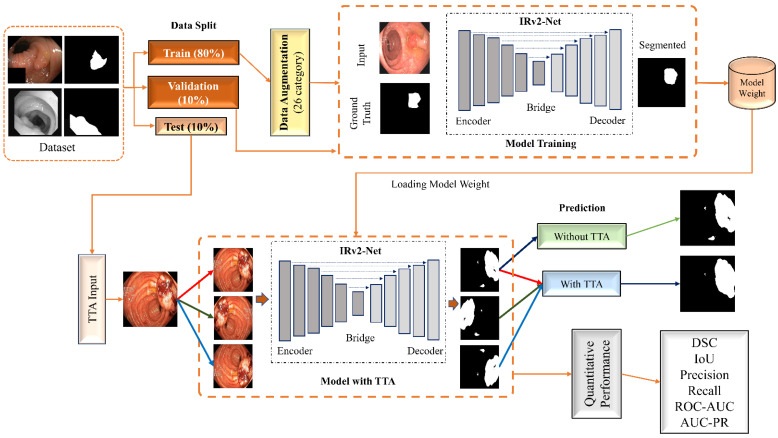
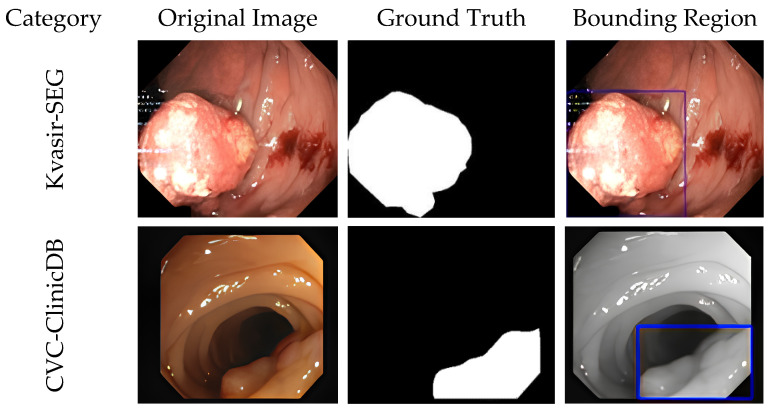
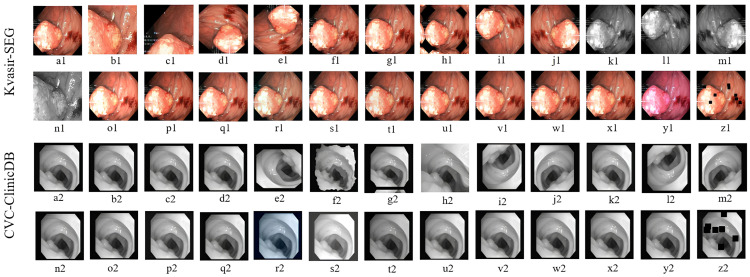
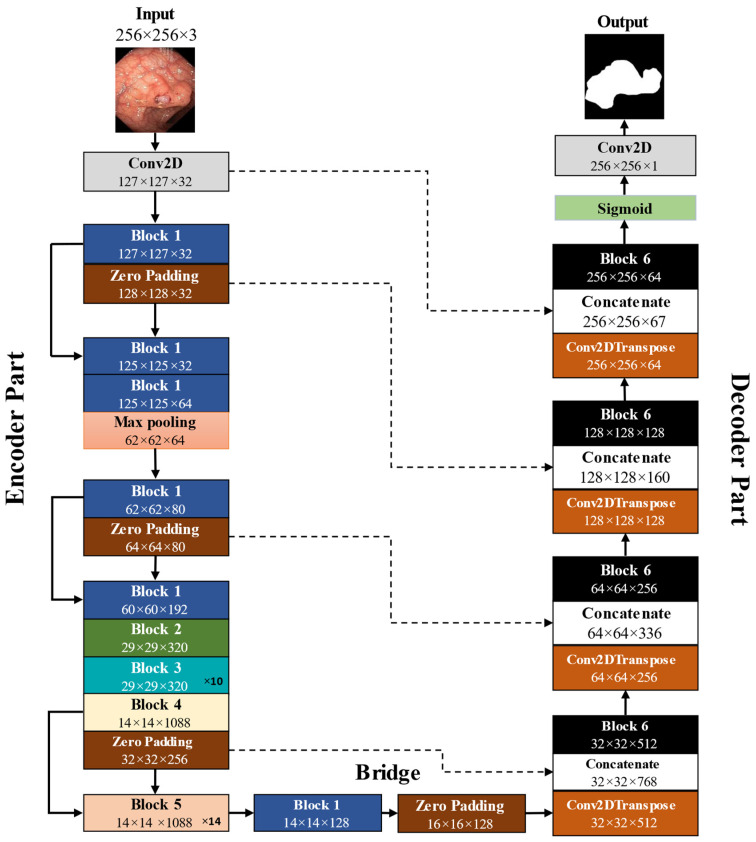
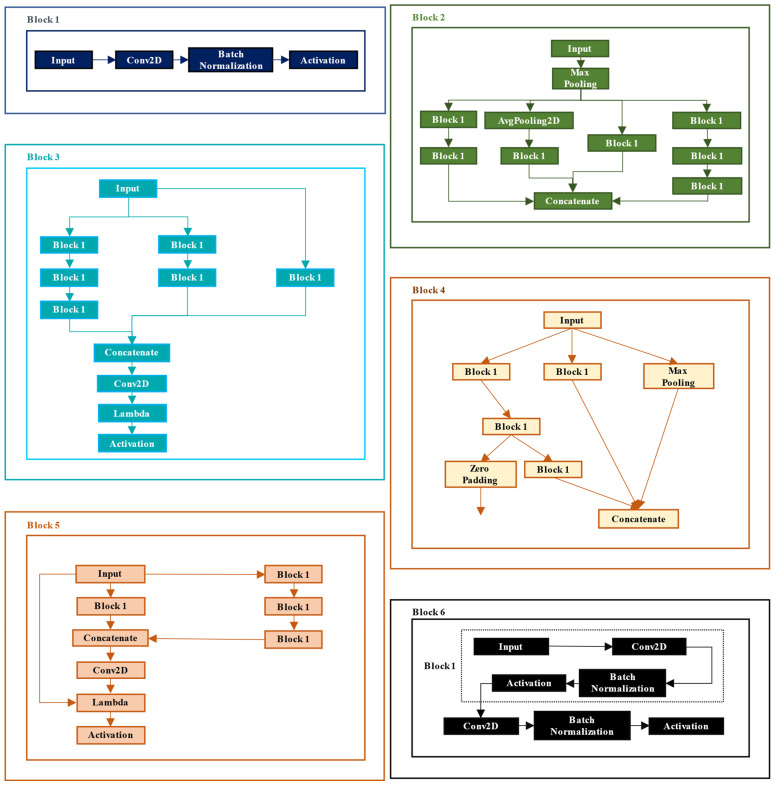
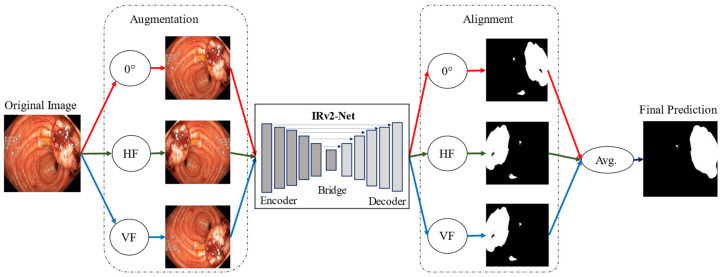
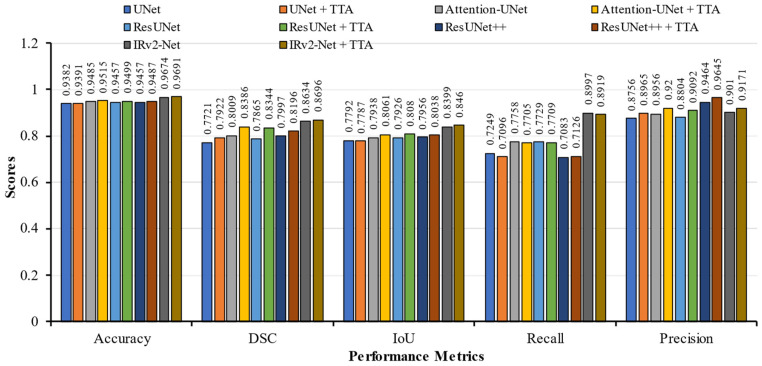
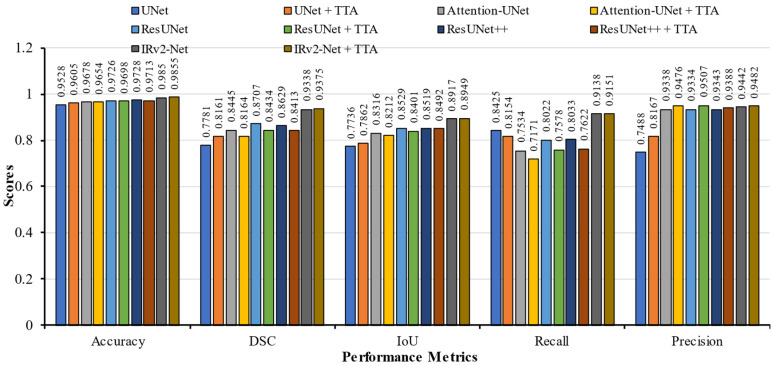
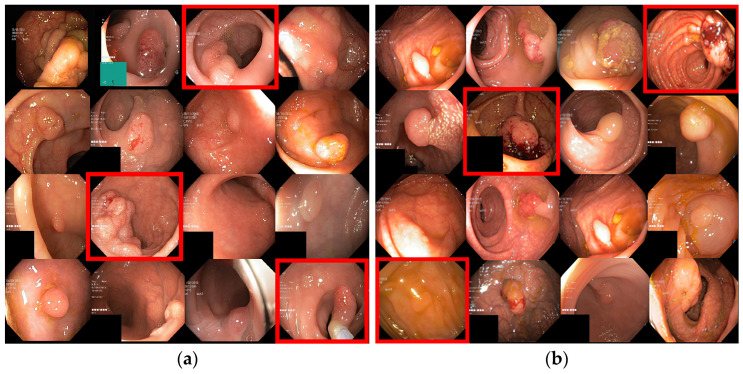
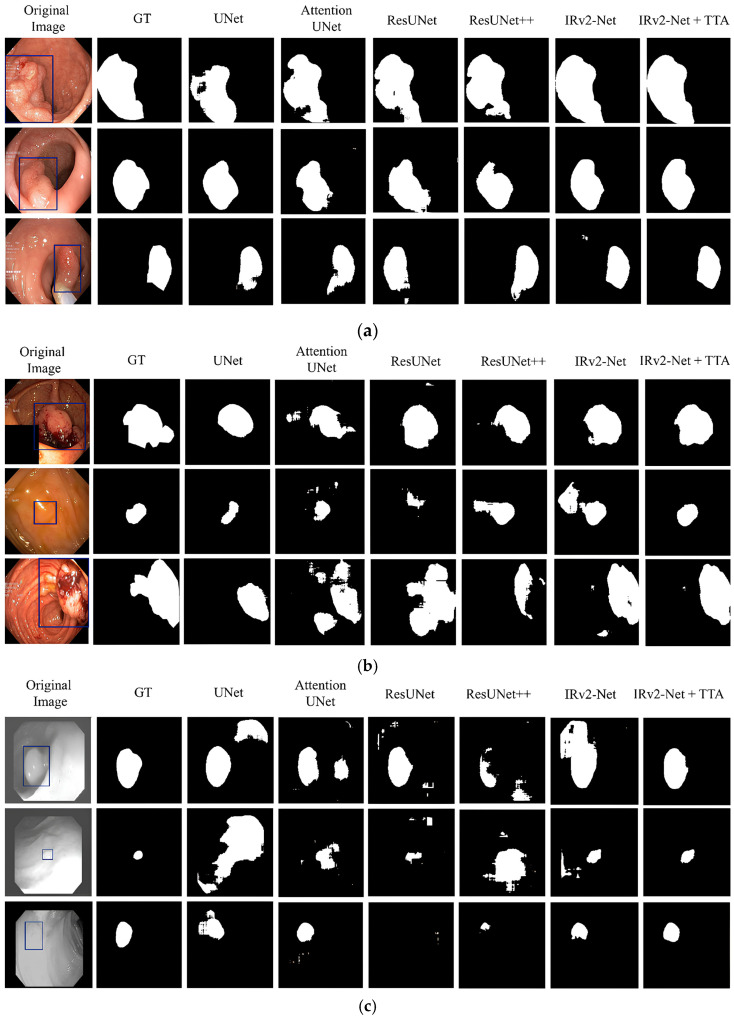
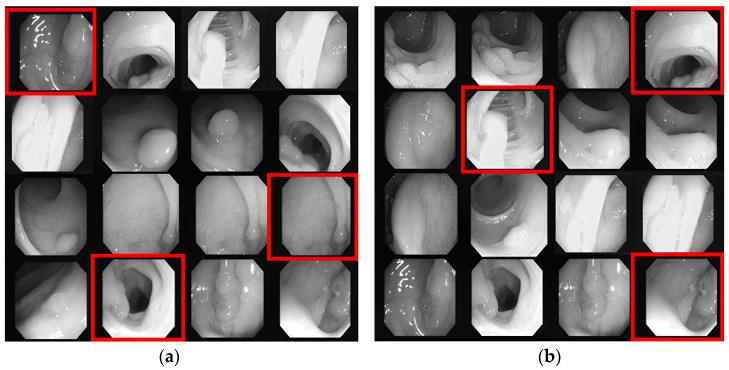
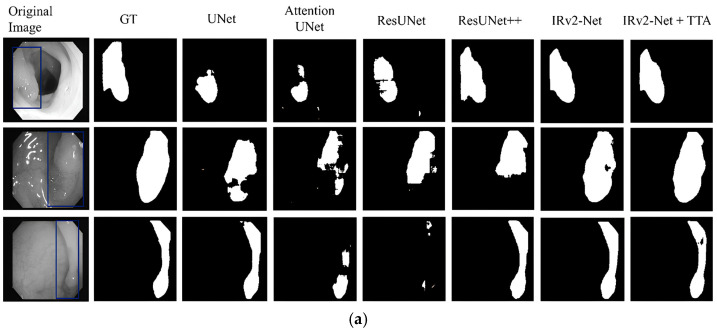
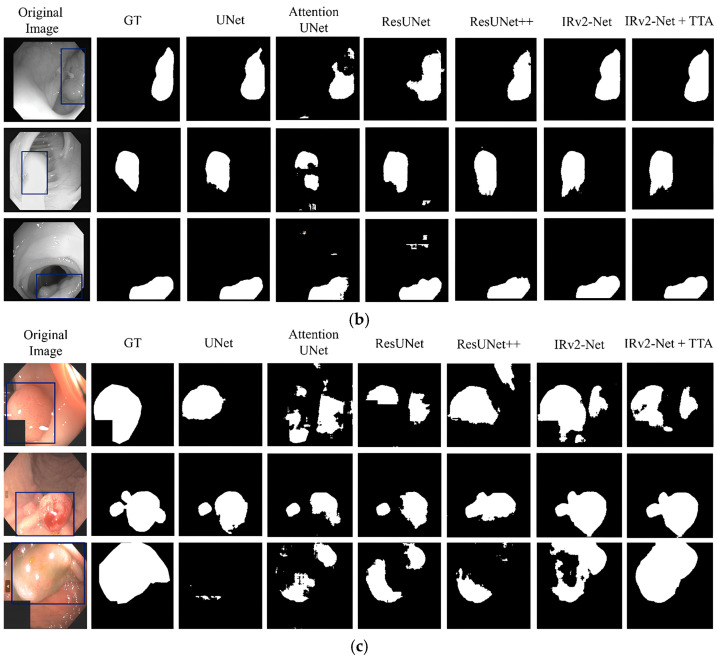
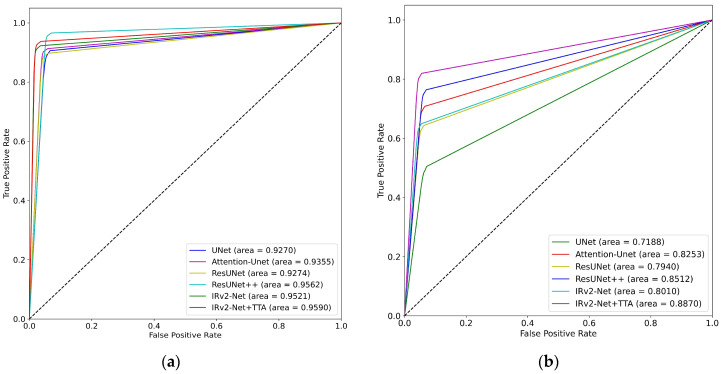
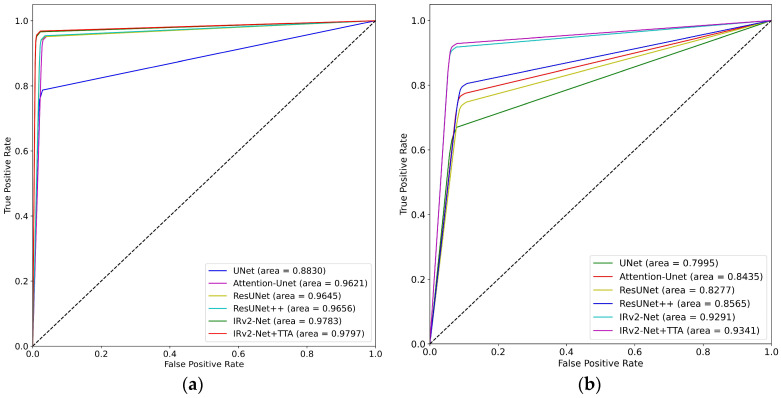
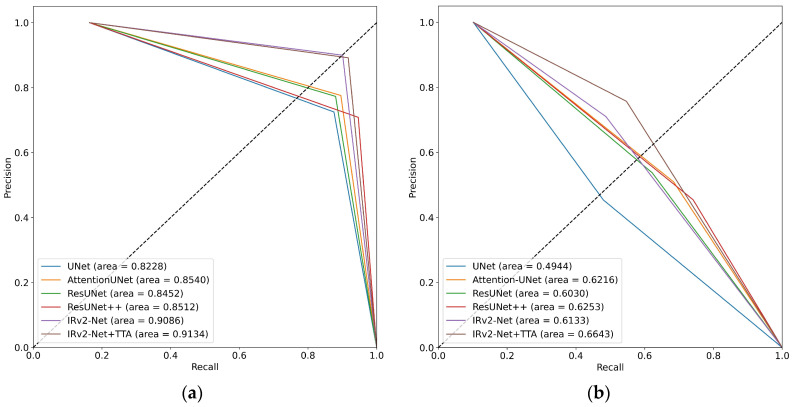
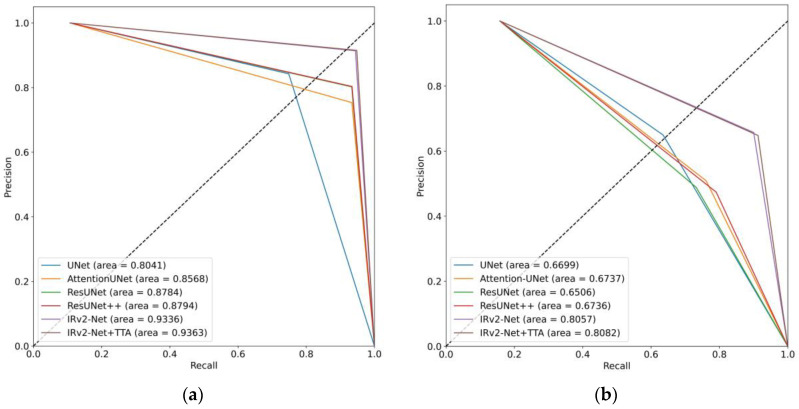
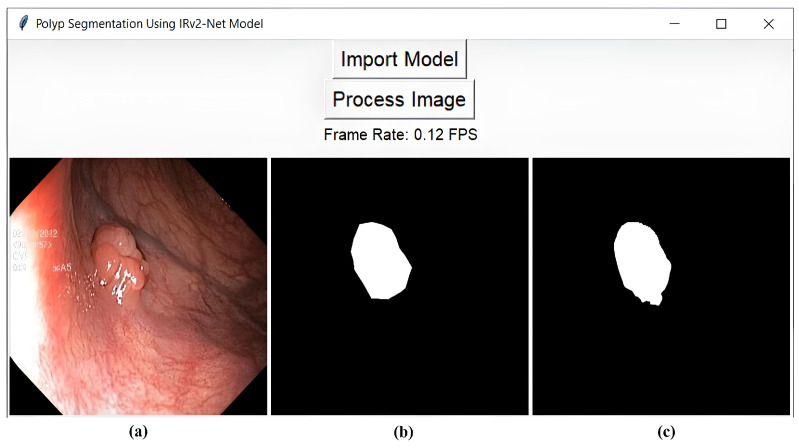
Colorectal polyps in the colon or rectum are precancerous growths that can lead to a more severe disease called colorectal cancer. Accurate segmentation of polyps using medical imaging data is essential for effective diagnosis. However, manual segmentation by endoscopists can be time-consuming, error-prone, and expensive, leading to a high rate of missed anomalies. To solve this problem, an automated diagnostic system based on deep learning algorithms is proposed to find polyps. The proposed IRv2-Net model is developed using the UNet architecture with a pre-trained InceptionResNetV2 encoder to extract most features from the input samples. The Test Time Augmentation (TTA) technique, which utilizes the characteristics of the original, horizontal, and vertical flips, is used to gain precise boundary information and multi-scale image features. The performance of numerous state-of-the-art (SOTA) models is compared using several metrics such as accuracy, Dice Similarity Coefficients (DSC), Intersection Over Union (IoU), precision, and recall. The proposed model is tested on the Kvasir-SEG and CVC-ClinicDB datasets, demonstrating superior performance in handling unseen real-time data. It achieves the highest area coverage in the area under the Receiver Operating Characteristic (ROC-AUC) and area under Precision-Recall (AUC-PR) curves. The model exhibits excellent qualitative testing outcomes across different types of polyps, including more oversized, smaller, over-saturated, sessile, or flat polyps, within the same dataset and across different datasets. Our approach can significantly minimize the number of missed rating difficulties. Lastly, a graphical interface is developed for producing the mask in real-time. The findings of this study have potential applications in clinical colonoscopy procedures and can serve based on further research and development.

Keywords: CVC-ClinicDB; IRv2-Net; Kvasir-SEG; colonoscopy; polyps; segmentation; test time augmentation.


Conflict of interest statement

The authors declare no conflict of interest.

Figures

Figure 1
Figure 1
A visual representation of a colonoscopy includes (a) an example of the endoscope, (b) an endoscope probe, which is inserted into the body to furnish endoscopic images, and (c) several examples of colorectal polyp images obtained during the colonoscopy procedure.
Figure 2
Figure 2
A visual representation of proposed research framework for segmenting the polyp regions. Dataset splitting into three categories (80% Training, 10% Validation, 10% Testing). Training and data pass through Data Augmentation before model training and the model is validated on validation data during model training. Final prediction is done with/without TTA Augmentation. Where original image is used to generate mask prediction without TTA and H-flipped, V-flipped images are used to generate mask prediction with TTA respectively. Finally, Quantitative analysis is performed on six different metrics.
Figure 3
Figure 3
Samples on both Kvasir-SEG and CVC-ClinicDB datasets are presented with ground truth and bounded box. Bounded rectangular blue and purple boxes denote the region of colorectal polyp.
Figure 4
Figure 4
An illustration of all pre-processing, which include (a1,a2) center crop, (b1,b2) crop, (c1,c2) random crop, (d1,d2) random 90-degree rotation, (e1,e2) transpose, (f1,f2) elastic transformation, (g1,g2) grid distortion, (h1,h2) optical distortion, (i1,i2) vertical flip, (j1,j2) horizontal flip, (k1,k2) grayscale conversion, (l1,l2) grayscale vertical flip, (m1,m2) grayscale horizontal flip, (n1,n2) grayscale center crop, (o1,o2) random brightness contrast, (p1,p2) random gamma, (q1,q2) hue saturation, (r1,r2) RGB shifting defines the random color change within red, green, and blue pixels, (s1,s2) random brightness, (t1,t2) random contrast, (u1,u2) motion blur, (v1,v2) median blur, (w1,w2) gaussian blur, (x1,x2) gaussian noise, (y1,y2) channel shuffling allows to rearrange these channels to create various visual effects, alter color balance, or apply artistic transformations to the image, and (z1,z2) coarse dropout which defines randomly setting rectangular black regions inside the images.
Figure 5
Figure 5
An overview of the architecture of IRv2-Net. The entire network consists of Encoder, Bridge and Decoder sections. Input Block is connected to a Conv2D Block followed by Block 1. Zero Padding Blocks are skip-connected to Concatenate Blocks. Block 1 to Block 6 are represented by different colors. Block 3 and Block 5 are repeating blocks. Block architectures are further explained in Figure 6.
Figure 6
Figure 6
A detailed breakdown of each Block that is used in the IRv2-Net architecture.
Figure 7
Figure 7
An illustration of the architecture for the proposed Test Time Augmentation where red arrow for the original sample, HF-horizontal flip (green arrow) and VF-vertical flip (blue arrow) are presented.
Figure 8
Figure 8
An illustration of performance metrics including accuracy, DSC, IoU, recall, and precision on Kvasir-SEG trained models.
Figure 9
Figure 9
An illustration of performance metrics including accuracy, DSC, IoU, recall, and precision on CVC-ClinicDB trained models.
Figure 10
Figure 10
This figure depicts the Kvasir-SEG test samples, which include (a) the samples with the highest DSC scores, and (b) the samples with the lowest DSC scores. Red-boxed images above are considered as the samples used to generate model predictions.
Figure 11
Figure 11
An illustration of predicted masks, where (a) prediction on top scored images (larger, medium, and small polyps), (b) prediction on bottom scored images (medium, flat and larger polyps), and (c) prediction on the CVC-ClinicDB dataset (medium, flat and small polyps). Blue-boxed regions signify the polyp regions in the Ground Truth mask.
Figure 12
Figure 12
This figure depicts the CVC-ClinicDB test samples, which include (a) the samples with the highest DSC scores, and (b) the samples with the lowest DSC scores. Red-boxed images above are considered as the samples used to generate model predictions.
Figure 13
Figure 13
An illustration of predicted polyp masks (blue boxes define the ground truth polyp areas), where (a) prediction on top scored images (medium, larger and flat polyps), (b) prediction on bottom scored images (medium, oversaturated and flat polyps), and (c) prediction on the Kvasir-SEG dataset (medium, small and larger polyps).
Figure 13
Figure 13
An illustration of predicted polyp masks (blue boxes define the ground truth polyp areas), where (a) prediction on top scored images (medium, larger and flat polyps), (b) prediction on bottom scored images (medium, oversaturated and flat polyps), and (c) prediction on the Kvasir-SEG dataset (medium, small and larger polyps).
Figure 14
Figure 14
ROC-AUC curves include (a) trained and tested on Kvasir-SEG dataset, and (b) trained on Kvasir-SEG and tested on CVC-ClinicDB dataset.
Figure 15
Figure 15
ROC-AUC curves include (a) trained and tested on CVC-ClinicDB dataset, and (b) trained on CVC-ClinicDB and tested on Kvasir-SEG dataset.
Figure 16
Figure 16
AUC-PR curves including (a) trained and tested on the Kvasir-SEG dataset, and (b) trained on Kvasir-SEG and tested on the CVC-ClinicDB dataset.
Figure 17
Figure 17
AUC-PR curves including (a) trained and tested on the CVC-ClinicDB dataset, and (b) trained on CVC-ClinicDB and tested on the Kvasir-SEG dataset.
Figure 18
Figure 18
Visualization of GUI interface includes (a) the original sample, (b) the ground truth, and (c) the predicted mask.

Similar articles

Cited by

References

    1. Bernal J., Sánchez F.J., Fernández-Esparrach G., Gil D., Rodríguez C., Vilariño F. WM-DOVA Maps for Accurate Polyp Highlighting in Colonoscopy: Validation vs. Saliency Maps from Physicians. Comput. Med. Imaging Graph. 2015;43:99–111. doi: 10.1016/j.compmedimag.2015.02.007. - DOI - PubMed
    1. Colorectal Cancer: Stages|Cancer.Net. [(accessed on 6 July 2023)]. Available online: https://www.cancer.net/cancer-types/colorectal-cancer/stages.
    1. Hassinger J.P., Hohibar S.D., Pendlirnari R., Dozois E.J., Larson D.W., Cima R.R. Effectiveness of a Multimedia-Based Educational Intervention for Improving Colon Cancer Literacy in Screening Colonoscopy Patients. Dis. Colon Rectum. 2010;53:1301–1307. doi: 10.1007/DCR.0b013e3181e291c0. - DOI - PubMed
    1. Burbige E.J. Irritable Bowel Syndrome: Diagnostic Approaches in Clinical Practice. Clin. Exp. Gastroenterol. 2010;3:127. doi: 10.2147/CEG.S12596. - DOI - PMC - PubMed
    1. Holzheimer R.G., Mannick J.A. Surgical Treatment: Evidence-Based and Problem-Oriented. Zuckschwerdt; Munich, Germany: 2001. - PubMed