. 2023 Sep 7;23(18):7743.
doi: 10.3390/s23187743.

Gait Monitoring and Analysis: A Mathematical Approach

Affiliations

Gait Monitoring and Analysis: A Mathematical Approach

Massimo Canonico et al. Sensors (Basel). .

Abstract

Gait abnormalities are common in the elderly and individuals diagnosed with Parkinson's, often leading to reduced mobility and increased fall risk. Monitoring and assessing gait patterns in these populations play a crucial role in understanding disease progression, early detection of motor impairments, and developing personalized rehabilitation strategies. In particular, by identifying gait irregularities at an early stage, healthcare professionals can implement timely interventions and personalized therapeutic approaches, potentially delaying the onset of severe motor symptoms and improving overall patient outcomes. In this paper, we studied older adults affected by chronic diseases and/or Parkinson's disease by monitoring their gait due to wearable devices that can accurately detect a person's movements. In our study, about 50 people were involved in the trial (20 with Parkinson's disease and 30 people with chronic diseases) who have worn our device for at least 6 months. During the experimentation, each device collected 25 samples from the accelerometer sensor for each second. By analyzing those data, we propose a metric for the "gait quality" based on the measure of entropy obtained by applying the Fourier transform.

Keywords: cloud computing; gait monitoring; telemedicine; wearable devices.


Conflict of interest statement

The authors declare no conflict of interest.

Figures

Figure 1
Figure 1
System architecture. The figure shows the smartwatch used for data collection, a web browser to access the web app on the left, and the two communication protocols used. On the right side, the figure shows the server side of the system consisting of two Node.js modules, a MongoDB database, and the Heroku platform used to host the web application.
Figure 2
Figure 2
Android smartwatch used for data collection.
Figure 3
Figure 3
Data of the controlled walks. Each figure showcases plots corresponding to different levels of degradation. (a) illustrates the acceleration intensity along the xyz-axis and the magnitude in the time domain. (b) presents a selected segment of the Fourier transform for the three walks. Lastly, (c) reveals the trends of entropy and the weighted mean of the Fourier transform, which were used as gait indices.
Figure 3
Figure 3
Data of the controlled walks. Each figure showcases plots corresponding to different levels of degradation. (a) illustrates the acceleration intensity along the xyz-axis and the magnitude in the time domain. (b) presents a selected segment of the Fourier transform for the three walks. Lastly, (c) reveals the trends of entropy and the weighted mean of the Fourier transform, which were used as gait indices.
Figure 4
Figure 4
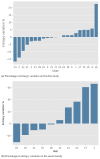
Results of the two studies. Every study’s percentage of entropy variation (y-axis) between the first and final week of data collection is reported per user (x-axis). In both studies, we applied a selection criterion to retain only those participants who conducted a minimum of 10 walks during the data collection period.
Figure 5
Figure 5
Gait index values and trends for participant 14. Each data point on the graph corresponds to an individual walk within the time frame indicated along the x-axis. The walks are spaced 1 day apart. Additionally, a regression line and the 95% confidence interval have been incorporated for both plots. The plot on the left illustrates the weighted mean, while the entropy value is displayed on the right.

References

    1. Lutz W., Sanderson W., Scherbov S. The coming acceleration of global population ageing. Nature. 2008;451:716–719. doi: 10.1038/nature06516. - DOI - PubMed
    1. Studenski S., Perera S., Patel K.V., Rosano C., Faulkner K., Inzitari M., Brach J., Chandler J., Cawthon P., Connor E.B. Gait speed and survival in older adults. JAMA. 2011;305:50–58. doi: 10.1001/jama.2010.1923. - DOI - PMC - PubMed
    1. Caristia S., Campani D., Cannici C., Frontera E., Giarda G., Pisterzi S., Terranova L., Payedimarri A.B., Faggiano F., Dal Molin A. Physical exercise and fall prevention: A systematic review and meta-analysis of experimental studies included in Cochrane reviews. Geriatr. Nurs. 2021;42:1275–1286. doi: 10.1016/j.gerinurse.2021.06.001. - DOI - PubMed
    1. Gambaro E., Gramaglia C., Azzolina D., Campani D., Molin A.D., Zeppegno P. The complex associations between late life depression, fear of falling and risk of falls. A systematic review and meta-analysis. Ageing Res. Rev. 2022;73:101532. doi: 10.1016/j.arr.2021.101532. - DOI - PubMed
    1. Campani D., Caristia S., Amariglio A., Piscone S., Ferrara L.I., Barisone M., Bortoluzzi S., Faggiano F., Dal Molin A., Group I.W. Home and environmental hazards modification for fall prevention among the elderly. Public Health Nurs. 2021;38:493–501. doi: 10.1111/phn.12852. - DOI - PMC - PubMed

LinkOut - more resources