

Quantitative Comparison of Hand Kinematics Measured with a Markerless Commercial Head-Mounted Display and a Marker-Based Motion Capture System in Stroke Survivors
- PMID: 37765963
- PMCID: PMC10535006
- DOI: 10.3390/s23187906
Quantitative Comparison of Hand Kinematics Measured with a Markerless Commercial Head-Mounted Display and a Marker-Based Motion Capture System in Stroke Survivors
Abstract
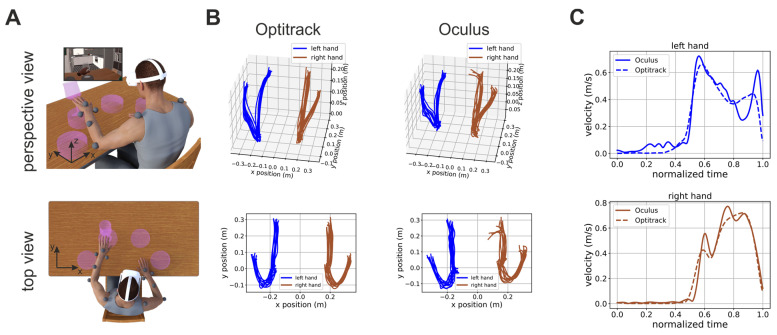
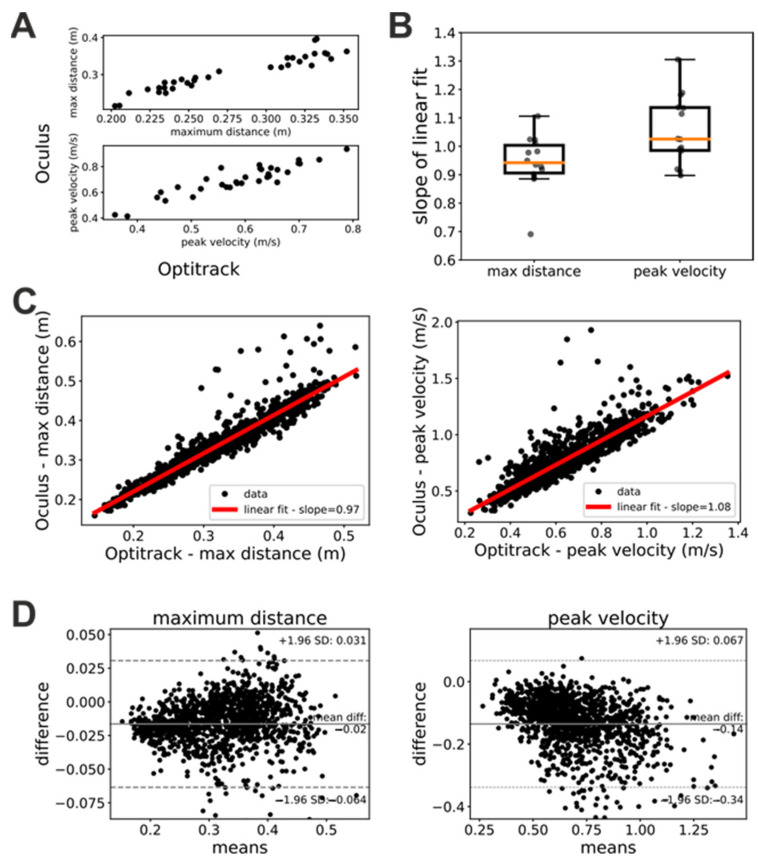
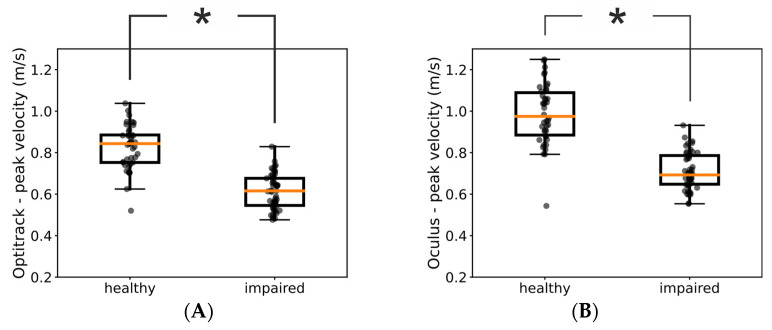
Upper-limb paresis is common after stroke. An important tool to assess motor recovery is to use marker-based motion capture systems to measure the kinematic characteristics of patients' movements in ecological scenarios. These systems are, however, very expensive and not readily available for many rehabilitation units. Here, we explored whether the markerless hand motion capabilities of the cost-effective Oculus Quest head-mounted display could be used to provide clinically meaningful measures. A total of 14 stroke patients executed ecologically relevant upper-limb tasks in an immersive virtual environment. During task execution, we recorded their hand movements simultaneously by means of the Oculus Quest's and a marker-based motion capture system. Our results showed that the markerless estimates of the hand position and peak velocity provided by the Oculus Quest were in very close agreement with those provided by a marker-based commercial system with their regression line having a slope close to 1 (maximum distance: mean slope = 0.94 ± 0.1; peak velocity: mean slope = 1.06 ± 0.12). Furthermore, the Oculus Quest had virtually the same sensitivity as that of a commercial system in distinguishing healthy from pathological kinematic measures. The Oculus Quest was as accurate as a commercial marker-based system in measuring clinically meaningful upper-limb kinematic parameters in stroke patients.
Keywords: Oculus Quest; Optitrack; head-mounted display; markerless motion capture system; motion analysis; motor recovery; stroke.
Conflict of interest statement
The authors declare no conflict of interest.
Figures
Similar articles
-
Virtual Reality for Shoulder Rehabilitation: Accuracy Evaluation of Oculus Quest 2.Sensors (Basel). 2022 Jul 23;22(15):5511. doi: 10.3390/s22155511. Sensors (Basel). 2022. PMID: 35898015 Free PMC article.
-
A quantitative assessment of the hand kinematic features estimated by the oculus Quest 2.Sci Rep. 2025 Mar 14;15(1):8842. doi: 10.1038/s41598-025-91552-5. Sci Rep. 2025. PMID: 40087370 Free PMC article.
-
Optimisation and Comparison of Markerless and Marker-Based Motion Capture Methods for Hand and Finger Movement Analysis.Sensors (Basel). 2025 Feb 11;25(4):1079. doi: 10.3390/s25041079. Sensors (Basel). 2025. PMID: 40006308 Free PMC article.
-
Methodological considerations for kinematic analysis of upper limbs in healthy and poststroke adults Part II: a systematic review of motion capture systems and kinematic metrics.Top Stroke Rehabil. 2019 Sep;26(6):464-472. doi: 10.1080/10749357.2019.1611221. Epub 2019 May 8. Top Stroke Rehabil. 2019. PMID: 31064281
-
Applications and limitations of current markerless motion capture methods for clinical gait biomechanics.PeerJ. 2022 Feb 25;10:e12995. doi: 10.7717/peerj.12995. eCollection 2022. PeerJ. 2022. PMID: 35237469 Free PMC article. Review.
Cited by
-
The Design and Validation of an Open-Palm Data Glove for Precision Finger and Wrist Tracking.Sensors (Basel). 2025 Jan 9;25(2):367. doi: 10.3390/s25020367. Sensors (Basel). 2025. PMID: 39860737 Free PMC article.
-
The Use of Head-Mounted Display Systems for Upper Limb Kinematic Analysis in Post-Stroke Patients: A Perspective Review on Benefits, Challenges and Other Solutions.Bioengineering (Basel). 2024 May 24;11(6):538. doi: 10.3390/bioengineering11060538. Bioengineering (Basel). 2024. PMID: 38927774 Free PMC article. Review.
-
Remotely Assessing Motor Function and Activity of the Upper Extremity After Stroke: A Systematic Review of Validity and Clinical Utility of Tele-Assessments.Clin Rehabil. 2024 Sep;38(9):1214-1225. doi: 10.1177/02692155241258867. Epub 2024 Jun 5. Clin Rehabil. 2024. PMID: 38839104 Free PMC article.
-
Head-Mounted Displays for Upper Limb Stroke Rehabilitation: A Scoping Review.J Clin Med. 2023 Nov 30;12(23):7444. doi: 10.3390/jcm12237444. J Clin Med. 2023. PMID: 38068496 Free PMC article.
-
A Sensor-Based Classification for Neuromotor Robot-Assisted Rehabilitation.Bioengineering (Basel). 2025 Mar 13;12(3):287. doi: 10.3390/bioengineering12030287. Bioengineering (Basel). 2025. PMID: 40150751 Free PMC article. Review.
References
-
- Warlow C., Gijn J., Dennis M., Wardlaw J., Bamford J., Hankey G., Sandercock P., Rinkel G., Langhorne P., Sudlow C., et al. Stroke-Practical Management. Wiley-Blackwell; Oxford, UK: 2008.
-
- World Health Organization . The World Health Report: 2003: Shaping the Future. World Health Organization; Geneva, Switzerland: 2003.
MeSH terms
LinkOut - more resources
Full Text Sources
Medical
