. 2023 Aug 24;11(9):1413.
doi: 10.3390/vaccines11091413.

Immune Response after SARS-CoV-2 Infection with Residual Post-COVID Symptoms

Affiliations

Immune Response after SARS-CoV-2 Infection with Residual Post-COVID Symptoms

Tanyaporn Pongkunakorn et al. Vaccines (Basel). .

Abstract

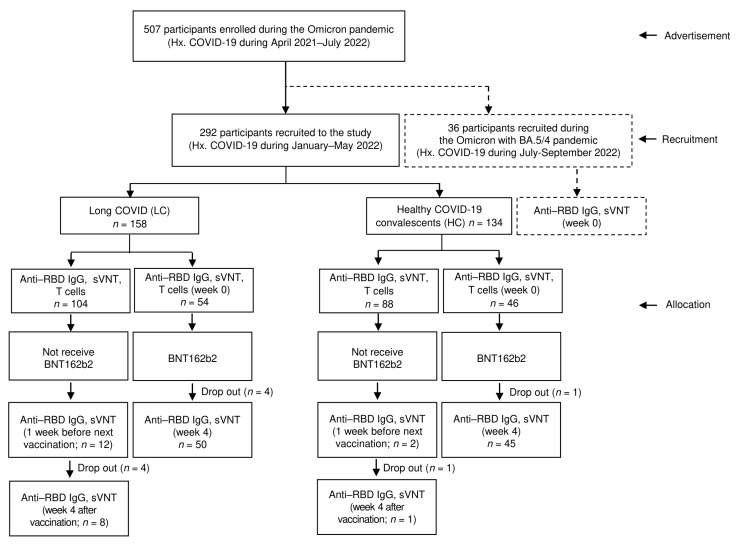
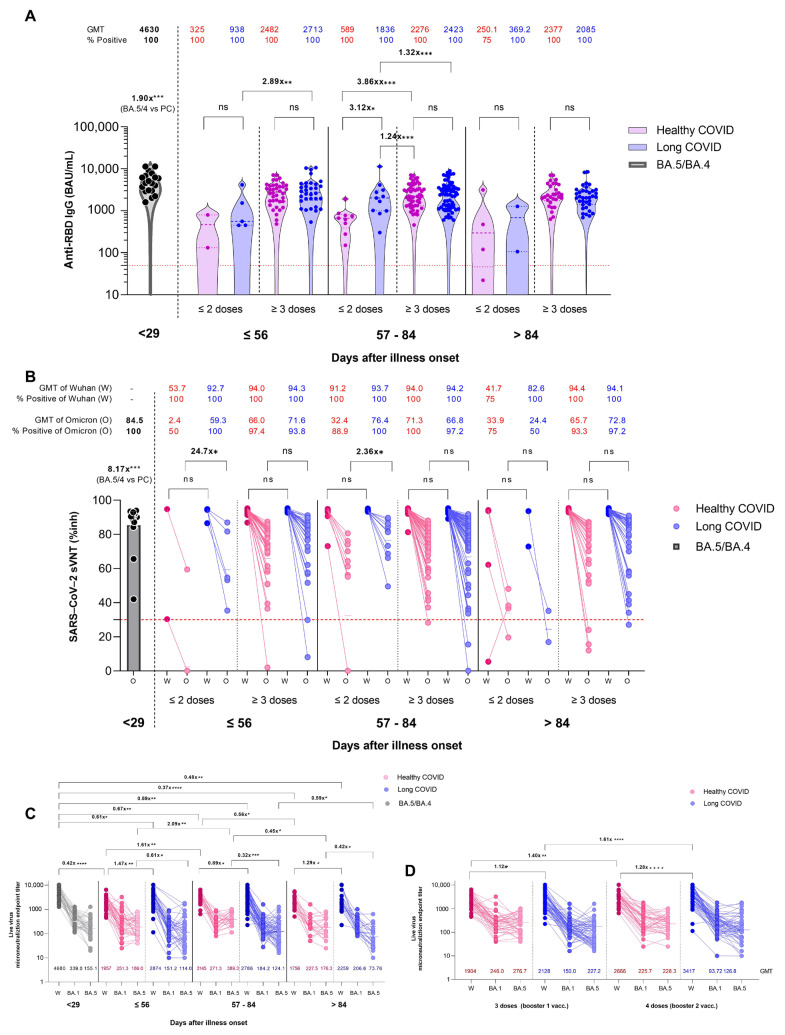
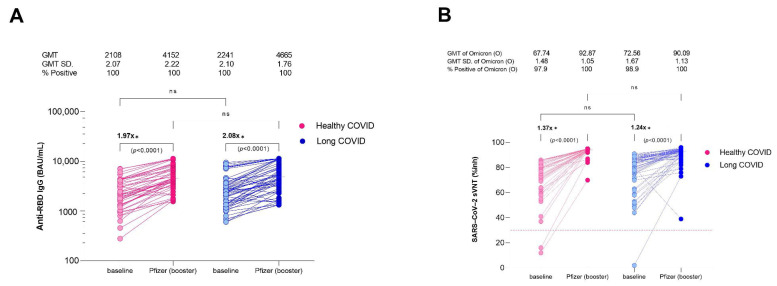
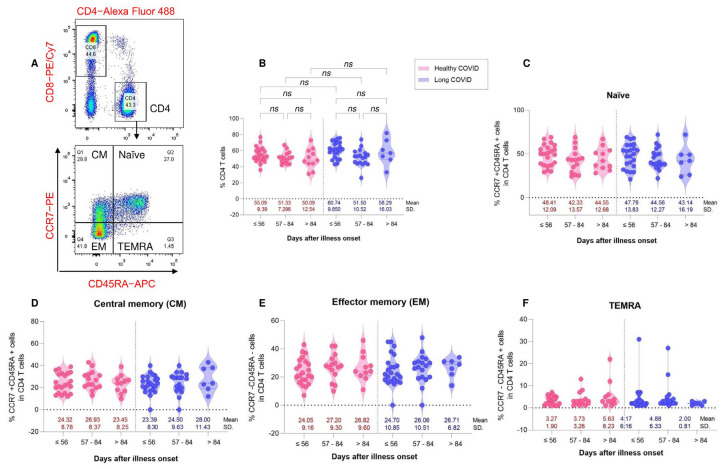
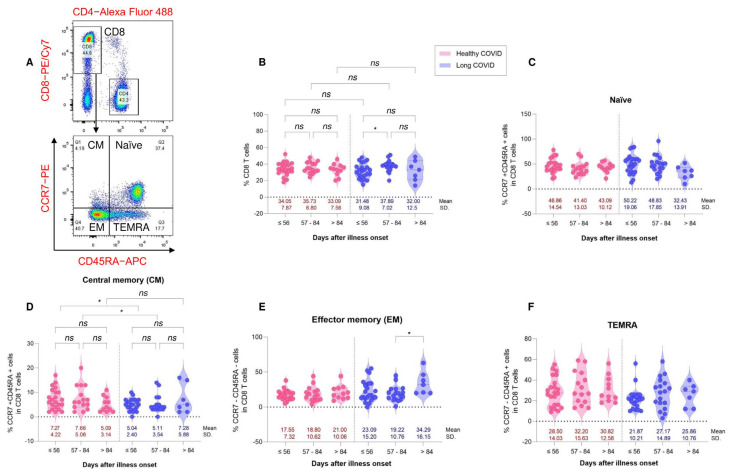
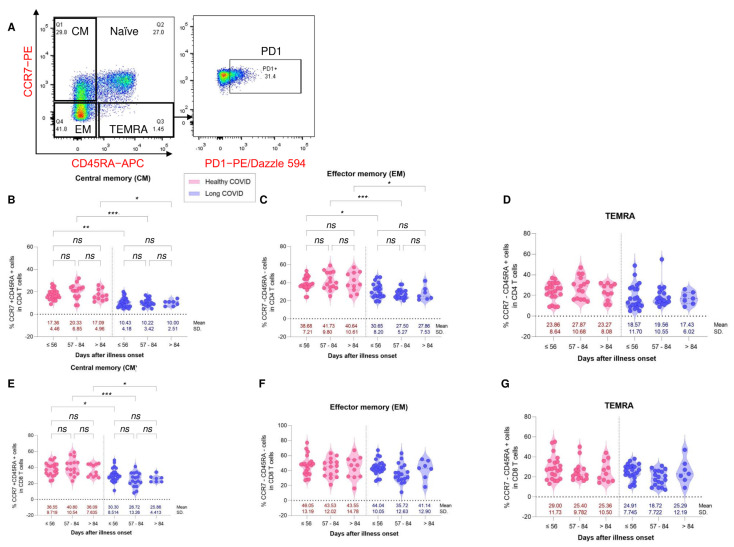
Many patients develop post-acute COVID syndrome (long COVID (LC)). We compared the immune response of LC and individuals with post-COVID full recovery (HC) during the Omicron pandemic. Two hundred ninety-two patients with confirmed COVID infections from January to May 2022 were enrolled. We observed anti-SARS-CoV-2 receptor-binding domain immunoglobulin G, surrogate virus neutralization test, T cell subsets, and neutralizing antibodies against Wuhan, BA.1, and BA.5 viruses (NeuT). NeuT was markedly reduced against BA.1 and BA.5 in HC and LC groups, while antibodies were more sustained with three doses and an updated booster shot than ≤2-dose vaccinations. The viral neutralization ability declined at >84-days after COVID-19 onset (PC) in both groups. PD1-expressed central and effector memory CD4+ T cells, and central memory CD8+ T cells were reduced in the first months PC in LC. Therefore, booster vaccines may be required sooner after the most recent infection to rescue T cell function for people with symptomatic LC.

Keywords: Omicron; breakthrough infection; immunogenicity; long COVID; neutralizing antibody.


Conflict of interest statement

The authors declare no conflict of interest. The funders had no role in the design of the study; in the collection, analyses, or interpretation of data; in the writing of the manuscript, or in the decision to publish the results.

Figures

Figure 1
Figure 1
Recruitment and enrolment for the study.
Figure 2
Figure 2
Comparison of immune responses of patients following breakthrough COVID-19 infection with prior vaccination during the Omicron pandemic. (1) Patients with healthy COVID recovery (HC, red dots), (2) patients with residual long COVID (LC, blue dots) and (3) patients during the BA.5/BA.4 wave (black color). (A) Geometric mean titers (GMTs) of SARS-CoV-2 anti-spike protein receptor-binding domain antibodies (anti-RBD IgG) in serum samples obtained from patients after COVID-19 infection and with previous varying vaccination status and duration PC. All sera were obtained from patients during the Omicron pandemic. The dotted line (red) represents the threshold for positive assay results. (B) Scatter plots illustrating inhibition rates of Wuhan and Omicron RBD-blocking antibodies, measured using a surrogate virus neutralization test (sVNT) by vaccination/reinfection status. The lower dotted line represents the cutoff for seropositivity. (C) Microneutralization endpoint titers against Wuhan and Omicron sub-lineages BA.2 and BA.5 live viruses in sera at different time points PC between HC, LC and BA.5/BA.4 groups. (D) Microneutralization endpoint titers against Wuhan and Omicron sub-lineages BA.2 and BA.5 live viruses in sera from individuals who had received 3 or 4 doses of vaccine between HC and LC groups. The generalized linear model was applied to evaluate the associations between the immune response (including IgG antibody and sVNT responses) and possible factors (vaccination, sex, and age). * p < 0.05; ** p < 0.01; *** p < 0.001; **** p < 0.0001. ns is a non-significant difference.
Figure 3
Figure 3
Comparison of immunogenicity against SARS-CoV-2 in patients with healthy COVID recovery (HC, red color) and patients with residual long COVID (LC, blue color) after a booster dose of the Pfizer-BioNTech mRNA vaccine, by scatter plot analysis, during the Omicron pandemic. (A) SARS-CoV-2 anti-spike protein antibodies to the receptor-binding domain (anti-RBD IgG) in serum samples from subjects 4 weeks after a 30 μg booster dose of Pfizer vaccine. (B) The inhibition rate of Omicron RBD antibodies was measured using a surrogate virus neutralization test (sVNT). The generalized linear model was applied to evaluate the association between the immunogenicity of anti-RBD IgG and the sVNT, and to identify potential predictive factors (sex and age). * p < 0.0001. ns is a nonsignificant difference.
Figure 4
Figure 4
Distribution of CD4+ T cells and CD4+ memory T cell subsets from healthy COVID recovery (HC, red color) and residual long COVID (LC, blue color). PBMCs were collected from HC (N = 48) and LC (N = 48) patients. PBMCs were stained with antibodies for multi-color flow cytometry to analyze the immunophenotype of T cell subsets. (Upper (A)) CD3+ cells were gated and CD4 and CD8 were plotted and the representative flow plot of naïve and memory CD4+ T cell subsets (lower (A)). (B) Percentages of CD4+ T cells in each subgroup of HC and LC patients. Respective percentages of naïve (CCR7+CD45RA+), central memory (CM, CCR7+CD45RA), effector memory (EM, CCR7CD45RA) and terminally differentiated effector memory (TEMRA, CCR7CD45RA+) subsets in CD4+ T cells (CF). Data are represented as mean with 95% CI. ns is a non-significant difference.
Figure 5
Figure 5
Distribution of CD8+ T cells and CD8+ memory T cell subsets of healthy COVID recovery (HC, red color) and residual long COVID (LC, blue color). PBMCs were collected from HC (N = 48) and LC (N = 48) patients. PBMCs were stained with antibodies for multi-color flow cytometry to analyze the immunophenotype of T cell subsets. (Upper (A)) CD3+ cells were gated and CD4 and CD8 were plotted. (Lower (A)) The representative flow plot of naïve and memory CD8+ T cell subsets. (B) Percentages of CD8+ T cells in each subgroup of HC and LC patients. Respective percentages of naïve (CCR7+CD45RA+), central memory (CM, CCR7+CD45RA), effector memory (EM, CCR7CD45RA) and terminally differentiated effector memory (TEMRA, CCR7CD45RA+) subsets in CD4+ T cells (CF). Data are represented as mean with 95% CI, with significance of * p ≤ 0.05. ns is a non-significant difference.
Figure 6
Figure 6
Expression of PD1 in memory T cell subsets from healthy COVID recovery (HC, red color) and residual long COVID (LC, blue color). PBMCs were collected from HC (N = 48) and LC (N = 48) patients. PBMCs were stained with antibodies for multi-color flow cytometry to analyze the immunophenotype of T cell subsets. CD3+ CD4+ cells and CD3+ CD8+ cells were gated. (Left (A)) CCR7 and CD45RA were plotted. (Right (A)) Representative flow plot of PD1 expressing cells was plotted. (BD) Respective percentages of PD1+ cells in central memory (CM, CCR7+CD45RA), effector memory (EM, CCR7CD45RA) and terminally differentiated effector memory (TEMRA, CCR7CD45RA+) subsets in CD4+ T cells. (EG) Respective percentages of PD1+ cells in central memory (CM, CCR7+CD45RA), effector memory (EM, CCR7CD45RA) and terminally differentiated effector memory (TEMRA, CCR7CD45RA+) subsets in CD8+ T cells. Data are represented as mean with 95% CI, with significance of * p ≤ 0.05, ** p ≤ 0.001, *** p ≤ 0.0001. ns is a non-significant difference.

Similar articles

Cited by

References

    1. Tuekprakhon A., Nutalai R., Dijokaite-Guraliuc A., Zhou D., Ginn H.M., Selvaraj M., Liu C., Mentzer A.J., Supasa P., Duyvesteyn H.M.E., et al. Antibody escape of SARS-CoV-2 Omicron BA.4 and BA.5 from vaccine and BA.1 serum. Cell. 2022;185:2422–2433.e13. doi: 10.1016/j.cell.2022.06.005. - DOI - PMC - PubMed
    1. Chemaitelly H., Tang P., Coyle P., Yassine H.M., Al-Khatib H.A., Smatti M.K., Hasan M.R., Ayoub H.H., Altarawneh H.N., Al-Kanaani Z., et al. Protection against Reinfection with the Omicron BA.2.75 Subvariant. N. Engl. J. Med. 2023;388:665–667. doi: 10.1056/NEJMc2214114. - DOI - PMC - PubMed
    1. Scarpa F., Sanna D., Benvenuto D., Borsetti A., Azzena I., Casu M., Fiori P.L., Giovanetti M., Maruotti A., Ceccarelli G., et al. Genetic and structural data on the SARS-CoV-2 omicron BQ.1 variant reveal its low potential for epidemiological expansion. Int. J. Mol. Sci. 2022;23:15264. doi: 10.3390/ijms232315264. - DOI - PMC - PubMed
    1. World Health Organization Thailand COVID-19—WHO Thailand Situation Reports. [(accessed on 30 April 2023)]. Available online: https://www.who.int/thailand/emergencies/novel-coronavirus-2019/situatio....
    1. UK Health Security Agency . SARS-CoV-2 Variants of Concern and Variants under Investigation in England: Technical Briefing 49. UK Health Security Agency; London, UK: 2023.