

Long-Term Immune Response Profiles to SARS-CoV-2 Vaccination and Infection in People with Multiple Sclerosis on Anti-CD20 Therapy
- PMID: 37766140
- PMCID: PMC10537223
- DOI: 10.3390/vaccines11091464
Long-Term Immune Response Profiles to SARS-CoV-2 Vaccination and Infection in People with Multiple Sclerosis on Anti-CD20 Therapy
Abstract
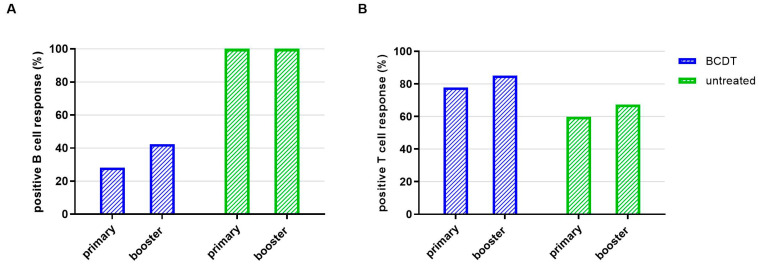
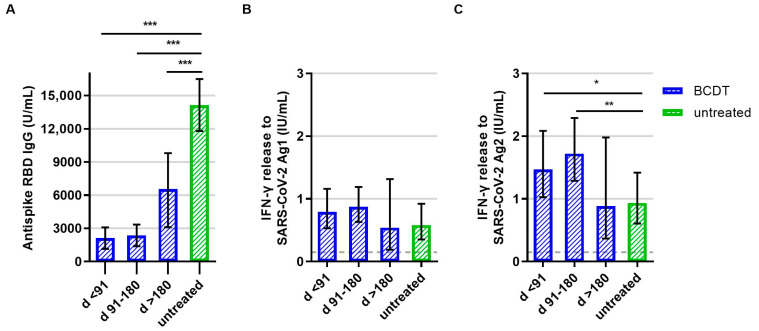
Our objective was to analyze longitudinal cellular and humoral immune responses to severe acute respiratory syndrome coronavirus 2 (SARS-CoV-2) vaccination in people with multiple sclerosis (pwMS) on B-cell depleting treatment (BCDT) compared to pwMS without immunotherapy. We further evaluated the impact of COVID-19 infection and vaccination timing. PwMS (n = 439) on BCDT (ocrelizumab, rituximab, ofatumumab) or without immunotherapy were recruited for this prospective cohort study between June 2021 and June 2022. SARS-CoV-2 spike-specific antibodies and interferon-γ release of CD4 and CD8 T-cells upon stimulation with spike protein peptide pools were analyzed at different timepoints (after primary vaccination, 3 and 6 months after primary vaccination, after booster vaccination, 3 months after booster). Humoral response to SARS-CoV-2 was consistently lower whereas T-cell response was higher in patients with BCDT compared to controls. Cellular and humoral responses decreased over time after primary vaccination and increased again upon booster vaccination, with significantly higher antibody titers after booster than after primary vaccination in both untreated and B-cell-depleted pwMS. COVID-19 infection further led to a significant increase in SARS-CoV-2-specific responses. Despite attenuated B-cell responses, a third vaccination for patients with BCDT seems recommendable, since at least partial protection can be expected from the strong T-cell response. Moreover, our data show that an assessment of T-cell responses may be helpful in B-cell-depleted patients to evaluate the efficacy of SARS-CoV-2 vaccination.
Keywords: SARS-CoV-2; anti-CD20 therapy; interferon-gamma release assay; multiple sclerosis; ocrelizumab; vaccination.
Conflict of interest statement
A.D. received personal compensation and travel grants from Sanofi-Aventis, Janssen-Cilag, Biogen, Celgene/Bristol Myers Squibb and Roche for speaker activity. T.Z. reports consulting or serving on speaker bureaus for Biogen, Celgene, Roche, Novartis, Celgene Merck and Sanofi as well as research support from Biogen, Novartis, Merck and Sanofi. KA received personal compensation from Roche, Sanofi, Alexion, Teva, Biogen, Novartis, and Celgene. R.P. and C.R. are employees of Hoffmann-La Roche. C.W. received travel support from Novartis. G.R., R.H., M.D., and Y.A. have nothing to disclose. The funders had no role in the design of the study; in the collection, analyses, or interpretation of data; in the writing of the manuscript; or in the decision to publish the results.
Figures


Similar articles
-
Timing of SARS-CoV-2 Vaccination Matters in People With Multiple Sclerosis on Pulsed Anti-CD20 Treatment.Neurol Neuroimmunol Neuroinflamm. 2022 Oct 12;9(6):e200031. doi: 10.1212/NXI.0000000000200031. Print 2022 Nov. Neurol Neuroimmunol Neuroinflamm. 2022. PMID: 36224045 Free PMC article.
-
B- and T-Cell Responses After SARS-CoV-2 Vaccination in Patients With Multiple Sclerosis Receiving Disease Modifying Therapies: Immunological Patterns and Clinical Implications.Front Immunol. 2022 Jan 17;12:796482. doi: 10.3389/fimmu.2021.796482. eCollection 2021. Front Immunol. 2022. PMID: 35111162 Free PMC article. Clinical Trial.
-
Long-lasting neutralizing antibodies and T cell response after the third dose of mRNA anti-SARS-CoV-2 vaccine in multiple sclerosis.Front Immunol. 2023 Jun 19;14:1205879. doi: 10.3389/fimmu.2023.1205879. eCollection 2023. Front Immunol. 2023. PMID: 37409134 Free PMC article.
-
NVX-CoV2373-induced T- and B-cellular immunity in immunosuppressed people with multiple sclerosis that failed to respond to mRNA and viral vector SARS-CoV-2 vaccines.Front Immunol. 2023 Jul 20;14:1081933. doi: 10.3389/fimmu.2023.1081933. eCollection 2023. Front Immunol. 2023. PMID: 37545513 Free PMC article.
-
Multiple Sclerosis Treatment in the COVID-19 Era: A Risk-Benefit Approach.Neurol Int. 2022 Apr 15;14(2):368-377. doi: 10.3390/neurolint14020030. Neurol Int. 2022. PMID: 35466211 Free PMC article. Review.
Cited by
-
Insights from Real-World Practice: The Dynamics of SARS-CoV-2 Infections and Vaccinations in a Large German Multiple Sclerosis Cohort.Vaccines (Basel). 2024 Mar 3;12(3):265. doi: 10.3390/vaccines12030265. Vaccines (Basel). 2024. PMID: 38543899 Free PMC article.
-
Interferon-β treatment reverses the detrimental effect of B-cell depletion therapy on respiratory virus infection.J Immunol. 2025 Jul 1;214(7):1688-1697. doi: 10.1093/jimmun/vkaf085. J Immunol. 2025. PMID: 40334083
-
Recall vaccination increases detectable B-cell reactivity in persons with multiple sclerosis treated with ocrelizumab.J Neurol. 2025 Apr 4;272(4):314. doi: 10.1007/s00415-025-13027-x. J Neurol. 2025. PMID: 40186086
-
The T-cell response to SARS-CoV- 2 vaccination persists beyond six months in rheumatoid arthritis patients treated with rituximab.Arthritis Res Ther. 2025 Apr 16;27(1):86. doi: 10.1186/s13075-025-03553-4. Arthritis Res Ther. 2025. PMID: 40241223 Free PMC article.
-
Vaccine-Induced Humoral and Cellular Response to SARS-CoV-2 in Multiple Sclerosis Patients on Ocrelizumab.Vaccines (Basel). 2025 Apr 30;13(5):488. doi: 10.3390/vaccines13050488. Vaccines (Basel). 2025. PMID: 40432100 Free PMC article.
References
-
- The Multiple Sclerosis International Federation (MSIF) Atlas of MS. 3rd ed. The Multiple Sclerosis International Federation (MSIF); London, UK: 2020.
-
- Milo R., Staun-Ram E., Karussis D., Karni A., Hellmann M.A., Bar-Haim E., Miller A., Glass-Marmor L., Volkovitz A., Dishon S., et al. Humoral and Cellular Immune Responses to SARS-CoV-2 MRNA Vaccination in Patients with Multiple Sclerosis: An Israeli Multi-Center Experience Following 3 Vaccine Doses. Front. Immunol. 2022;13:868915. doi: 10.3389/fimmu.2022.868915. - DOI - PMC - PubMed
-
- Apostolidis S.A., Kakara M., Painter M.M., Goel R.R., Mathew D., Lenzi K., Rezk A., Patterson K.R., Espinoza D.A., Kadri J.C., et al. Cellular and Humoral Immune Responses Following SARS-CoV-2 MRNA Vaccination in Patients with Multiple Sclerosis on Anti-CD20 Therapy. Nat. Med. 2021;27:1990–2001. doi: 10.1038/s41591-021-01507-2. - DOI - PMC - PubMed
-
- Räuber S., Korsen M., Huntemann N., Rolfes L., Müntefering T., Dobelmann V., Hermann A.M., Kölsche T., von Wnuck Lipinski K., Schroeter C.B., et al. Immune Response to SARS-CoV-2 Vaccination in Relation to Peripheral Immune Cell Profiles among Patients with Multiple Sclerosis Receiving Ocrelizumab. J. Neurol. Neurosurg. Psychiatry. 2022;93:978–985. doi: 10.1136/jnnp-2021-328197. - DOI - PMC - PubMed
Grants and funding
LinkOut - more resources
Full Text Sources
Research Materials
Miscellaneous
