. 2023 Aug 25;15(9):1808.
doi: 10.3390/v15091808.

EBV and 1q Gains Affect Gene and miRNA Expression in Burkitt Lymphoma

Affiliations

EBV and 1q Gains Affect Gene and miRNA Expression in Burkitt Lymphoma

Nuray Akyüz et al. Viruses. .

Abstract

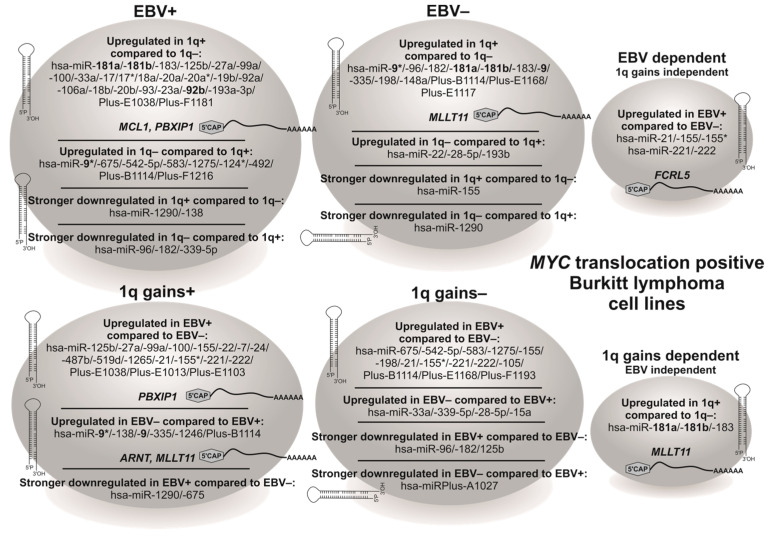
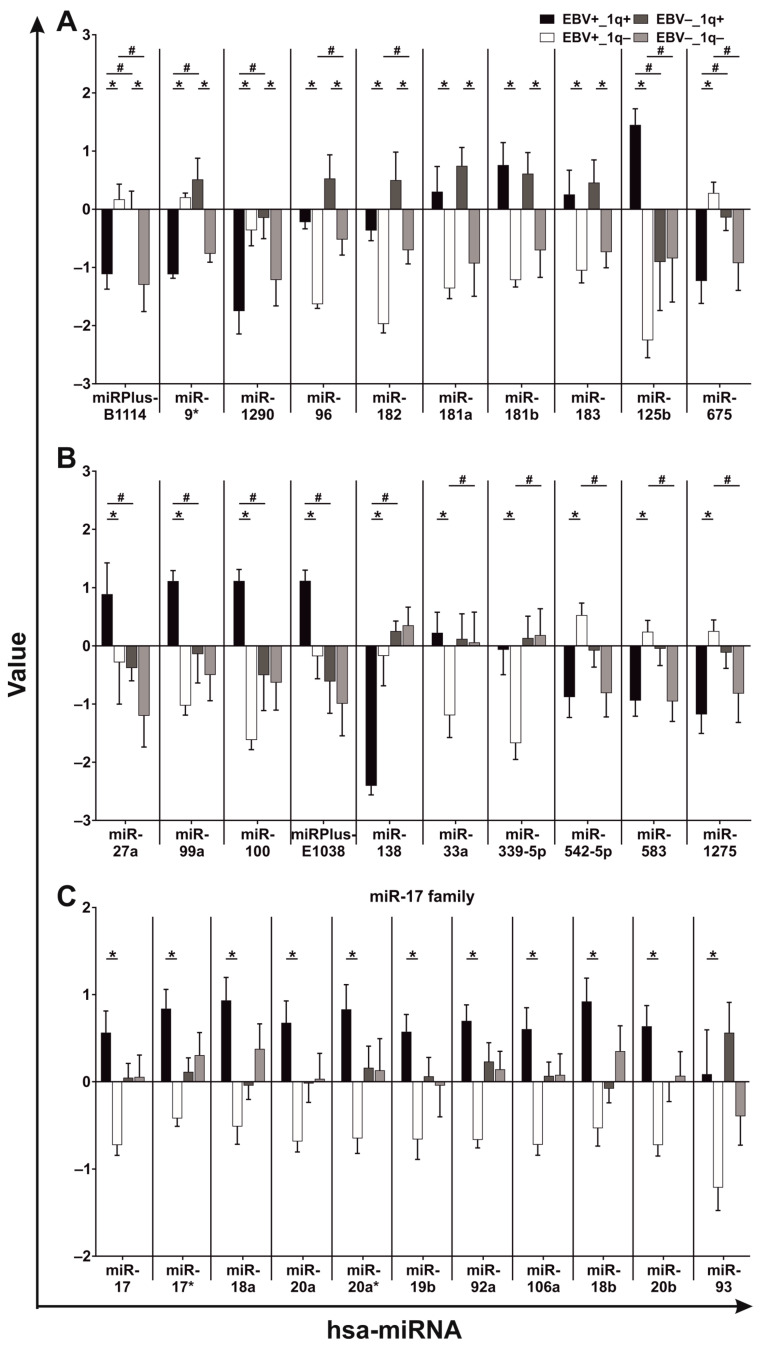
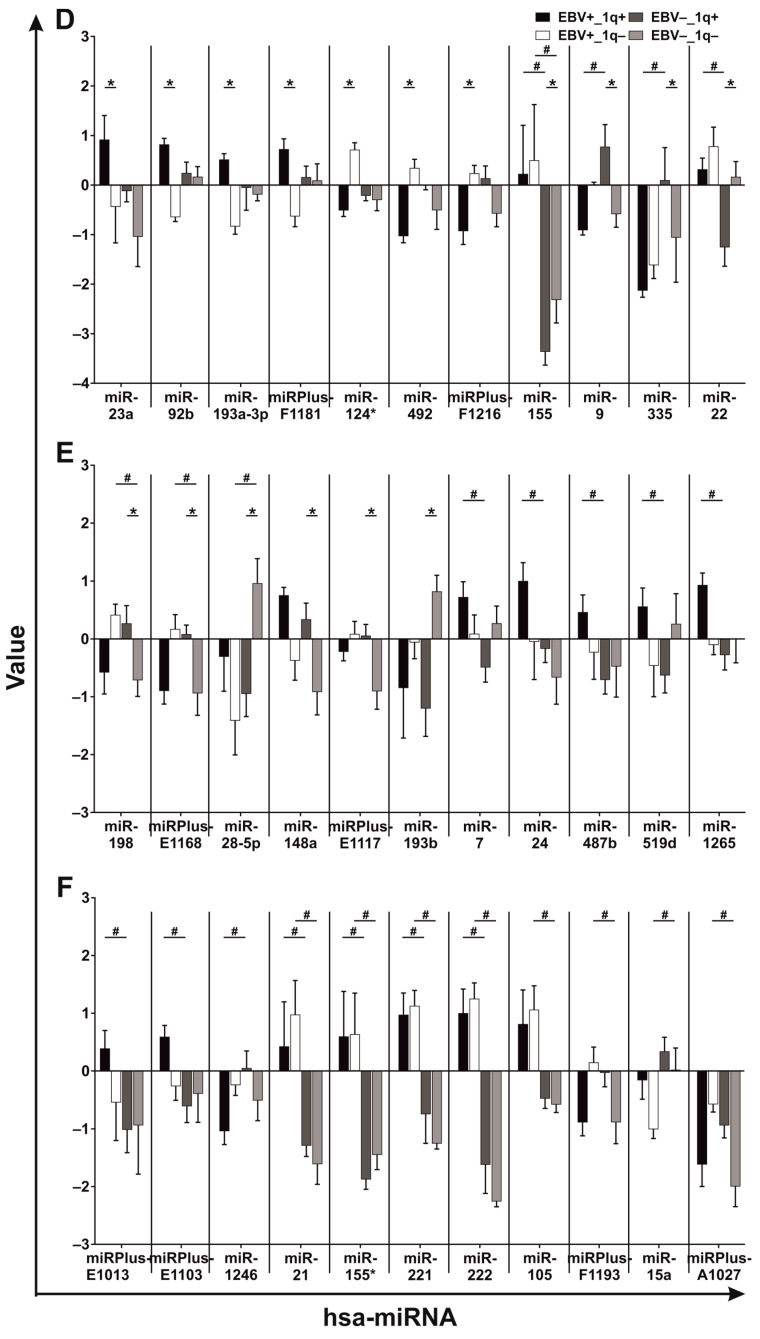
Abnormalities of the long arm of chromosome 1 (1q) represent the most frequent secondary chromosomal aberrations in Burkitt lymphoma (BL) and are observed almost exclusively in EBV-negative BL cell lines (BL-CLs). To verify chromosomal abnormalities, we cytogenetically investigated EBV-negative BL patient material, and to elucidate the 1q gain impact on gene expression, we performed qPCR with six 1q-resident genes and analyzed miRNA expression in BL-CLs. We observed 1q aberrations in the form of duplications, inverted duplications, isodicentric chromosome idic(1)(q10), and the accumulation of 1q12 breakpoints, and we assigned 1q21.2-q32 as a commonly gained region in EBV-negative BL patients. We detected MCL1, ARNT, MLLT11, PDBXIP1, and FCRL5, and 64 miRNAs, showing EBV- and 1q-gain-dependent dysregulation in BL-CLs. We observed MCL1, MLLT11, PDBXIP1, and 1q-resident miRNAs, hsa-miR-9, hsa-miR-9*, hsa-miR-92b, hsa-miR-181a, and hsa-miR-181b, showing copy-number-dependent upregulation in BL-CLs with 1q gains. MLLT11, hsa-miR-181a, hsa-miR-181b, and hsa-miR-183 showed exclusive 1q-gains-dependent and FCRL5, hsa-miR-21, hsa-miR-155, hsa-miR-155*, hsa-miR-221, and hsa-miR-222 showed exclusive EBV-dependent upregulation. We confirmed previous data, e.g., regarding the EBV dependence of hsa-miR-17-92 cluster members, and obtained detailed information considering 1q gains in EBV-negative and EBV-positive BL-CLs. Altogether, our data provide evidence for a non-random involvement of 1q gains in BL and contribute to enlightening and understanding the EBV-negative and EBV-positive BL pathogenesis.

Keywords: 1q gains; Burkitt lymphoma; EBV; FISH; miRNA; qPCR.


Conflict of interest statement

The authors declare no conflict of interest.

Figures

Figure 1
Figure 1
Analysis of the 1q abnormalities using dual-color metaphase FISH. Representative images showing 1q duplication (A) and inverted duplication (C) in patient-1 using the BAC clones RP11-553K8 (green) and RP11-42A2 (red). The abnormal chromosomes are indicated by arrowheads. In (A,C), representative dual color FISH images are shown and in (B,D), the corresponding G-banding images are shown (E) Summary of the 1q aberrations achieved by FISH on primary material. The BAC clones selected for this study and their cytogenetic positions are indicated on the right side of the 1q ideogram. The vertical lines indicate the overrepresented chromosomal region as assessed by FISH and correspond to the following patients (from left to right); duplications: patient-1; inverted duplications: patients-1 and -2; partial trisomies: patients-2 and -3. The minimal commonly gained-region 1q21.2–q22 delineated in our previous report using BL-CLs [33] is shaded in grey and indicated with CL (cell lines), and the commonly gained region 1q21.2–q32 delineated in our present study using primary material is indicated with PM (primary material). Pat1–3: Patient-1–3.
Figure 1
Figure 1
Analysis of the 1q abnormalities using dual-color metaphase FISH. Representative images showing 1q duplication (A) and inverted duplication (C) in patient-1 using the BAC clones RP11-553K8 (green) and RP11-42A2 (red). The abnormal chromosomes are indicated by arrowheads. In (A,C), representative dual color FISH images are shown and in (B,D), the corresponding G-banding images are shown (E) Summary of the 1q aberrations achieved by FISH on primary material. The BAC clones selected for this study and their cytogenetic positions are indicated on the right side of the 1q ideogram. The vertical lines indicate the overrepresented chromosomal region as assessed by FISH and correspond to the following patients (from left to right); duplications: patient-1; inverted duplications: patients-1 and -2; partial trisomies: patients-2 and -3. The minimal commonly gained-region 1q21.2–q22 delineated in our previous report using BL-CLs [33] is shaded in grey and indicated with CL (cell lines), and the commonly gained region 1q21.2–q32 delineated in our present study using primary material is indicated with PM (primary material). Pat1–3: Patient-1–3.
Figure 2
Figure 2
Differential expression of six genes located at 1q21.2–q22 in BL-CLs. The figure shows the expression level of BCL9 (A), MCL1 (B), ARNT (C), MLLT11 (D), PBXIP1 (E) and FCRL5 (F) relative to their mRNA level detected in the BL-28, an EBV− BL cell line without 1q aberrations. The localization of the investigated genes, their transcriptional direction (indicated with an arrow) and the BAC clones covering their position are highlighted on the 1q ideogram (G). Expression levels in EBV-negative (EBV−) BL-CLs are shown as empty bars and in EBV-positive (EBV+) BL-CLs as black bars. Note that 4 EBV− and 12 EBV+ BL-CLs without (w/o) 1q gains and 13 EBV− and 8 EBV+ BL-CLs with 1q gains were investigated in this study. Each sample was measured in two independent qPCR experiments prepared as duplicates. *: p < 0.05; **: p < 0.01; ***: p < 0.001; ****: p < 0.0001 (two-way ANOVA followed by Tukey’s multiple comparisons test).
Figure 3
Figure 3
Summary of the expression profiles of the significantly dysregulated mRNAs and miRNAs in MYC translocation positive BL-CLs depending on their EBV and 1q gain status. The 1q resident miRNAs hsa-miR-9, hsa-miR-9*, hsa-miR-92b, hsa-miR-181a and hsa-miR181b are highlighted in bold letters. The significantly dysregulated mRNAs are indicated in bold and italic letters. The drawing of a hairpin structure indicates miRNA and curved line with a 5′-Cap and 3′-poly-A tail indicates mRNA.
Figure 4
Figure 4
EBV- and 1q-gains-dependent miRNA expression in BL-CLs. Expression profiles of 64 significantly dysregulated miRNAs in BL-CLs depending on their EBV and 1q gain status are shown as diagrams (AF). All miRNAs are numbered according to their appearance in this figure indicated under their names. Value: log2 normalized Hy3/Hy5 ratios. Statistical analysis: two-way ANOVA followed by Tukey’s multiple comparisons test, * indicates the comparison between the BL-CL groups with 1q gains (1q+) vs. without 1q gains (1q−) (p < 0.05) and # indicates the comparison between the BL-CL groups EBV-positive (EBV+) vs. EBV-negative (EBV−) (p < 0.05).
Figure 4
Figure 4
EBV- and 1q-gains-dependent miRNA expression in BL-CLs. Expression profiles of 64 significantly dysregulated miRNAs in BL-CLs depending on their EBV and 1q gain status are shown as diagrams (AF). All miRNAs are numbered according to their appearance in this figure indicated under their names. Value: log2 normalized Hy3/Hy5 ratios. Statistical analysis: two-way ANOVA followed by Tukey’s multiple comparisons test, * indicates the comparison between the BL-CL groups with 1q gains (1q+) vs. without 1q gains (1q−) (p < 0.05) and # indicates the comparison between the BL-CL groups EBV-positive (EBV+) vs. EBV-negative (EBV−) (p < 0.05).

Similar articles

Cited by

References

    1. Johansson B., Brondum-Nielsen K., Billstrom R., Schiodt I., Mitelman F. Translocations between the long arms of chromosomes 1 and 5 in hematologic malignancies are strongly associated with neoplasms of the myeloid lineages. Cancer Genet. Cytogenet. 1997;99:97–101. doi: 10.1016/S0165-4608(97)00198-2. - DOI - PubMed
    1. Itoyama T., Nanjungud G., Chen W., Dyomin V.G., Teruya-Feldstein J., Jhanwar S.C., Zelenetz A.D., Chaganti R.S. Molecular cytogenetic analysis of genomic instability at the 1q12-22 chromosomal site in B-cell non-Hodgkin lymphoma. Genes Chromosomes Cancer. 2002;35:318–328. doi: 10.1002/gcc.10120. - DOI - PubMed
    1. Sawyer J.R., Tricot G., Lukacs J.L., Binz R.L., Tian E., Barlogie B., Shaughnessy J., Jr. Genomic instability in multiple myeloma: Evidence for jumping segmental duplications of chromosome arm 1q. Genes Chromosomes Cancer. 2005;42:95–106. doi: 10.1002/gcc.20109. - DOI - PubMed
    1. Gunnarsson R., Dilorenzo S., Lundin-Strom K.B., Olsson L., Biloglav A., Lilljebjorn H., Rissler M., Wahlberg P., Lundmark A., Castor A., et al. Mutation, methylation, and gene expression profiles in dup(1q)-positive pediatric B-cell precursor acute lymphoblastic leukemia. Leukemia. 2018;32:2117–2125. doi: 10.1038/s41375-018-0092-2. - DOI - PMC - PubMed
    1. Offit K., Jhanwar S.C., Ladanyi M., Filippa D.A., Chaganti R.S. Cytogenetic analysis of 434 consecutively ascertained specimens of non-Hodgkin’s lymphoma: Correlations between recurrent aberrations, histology, and exposure to cytotoxic treatment. Genes Chromosomes Cancer. 1991;3:189–201. doi: 10.1002/gcc.2870030304. - DOI - PubMed

LinkOut - more resources