

Mathematical Modeling of Oncolytic Virus Therapy Reveals Role of the Immune Response
- PMID: 37766219
- PMCID: PMC10536413
- DOI: 10.3390/v15091812
Mathematical Modeling of Oncolytic Virus Therapy Reveals Role of the Immune Response
Abstract
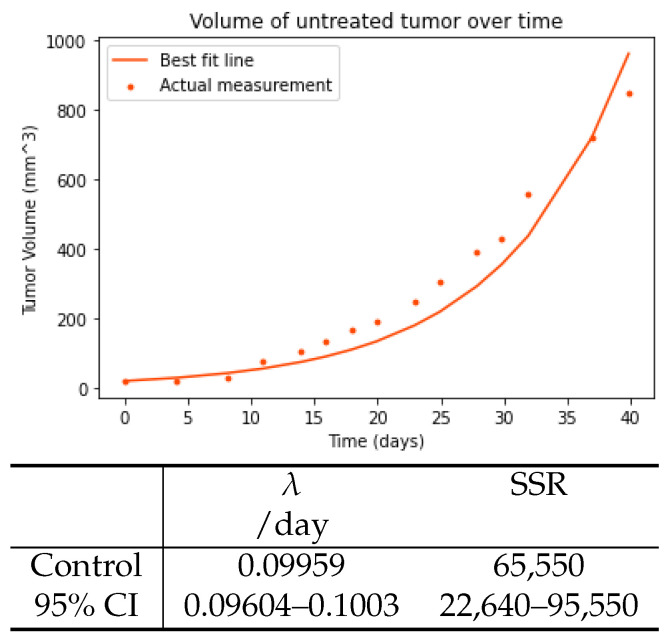
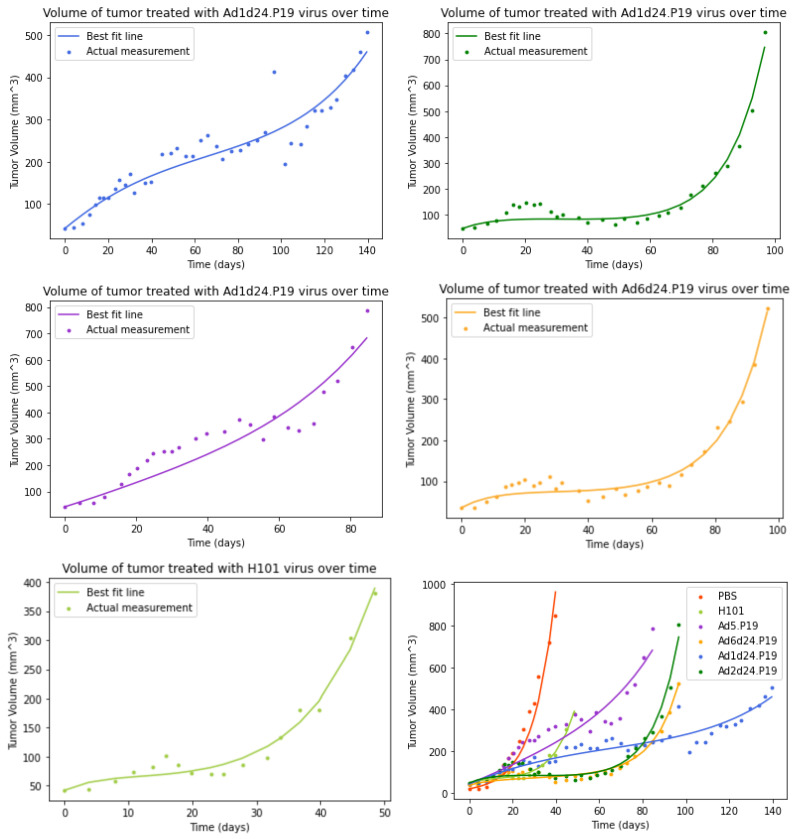
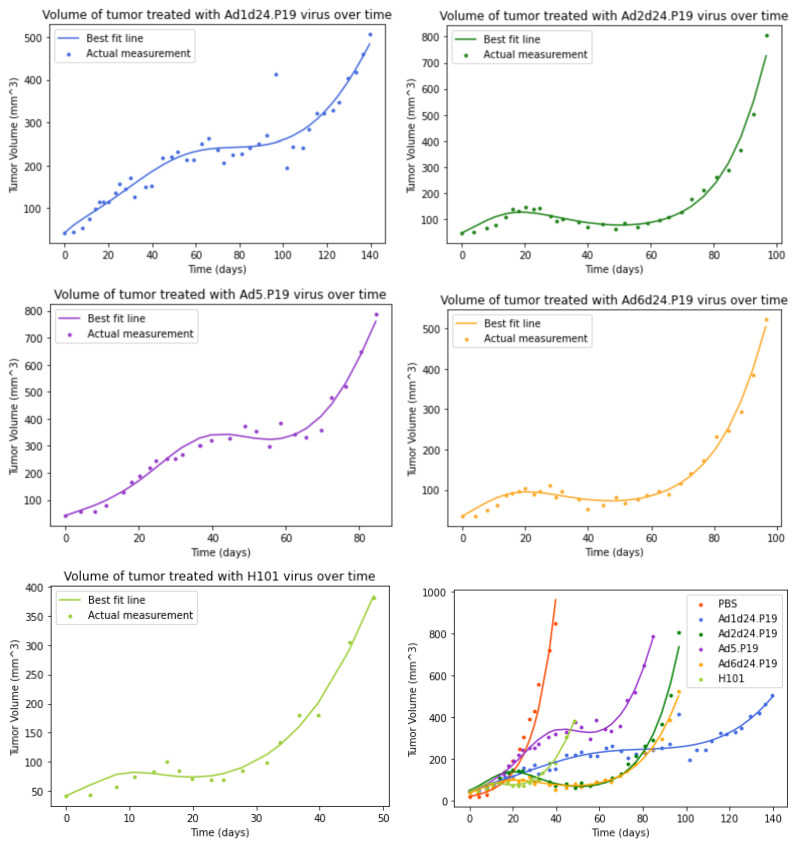
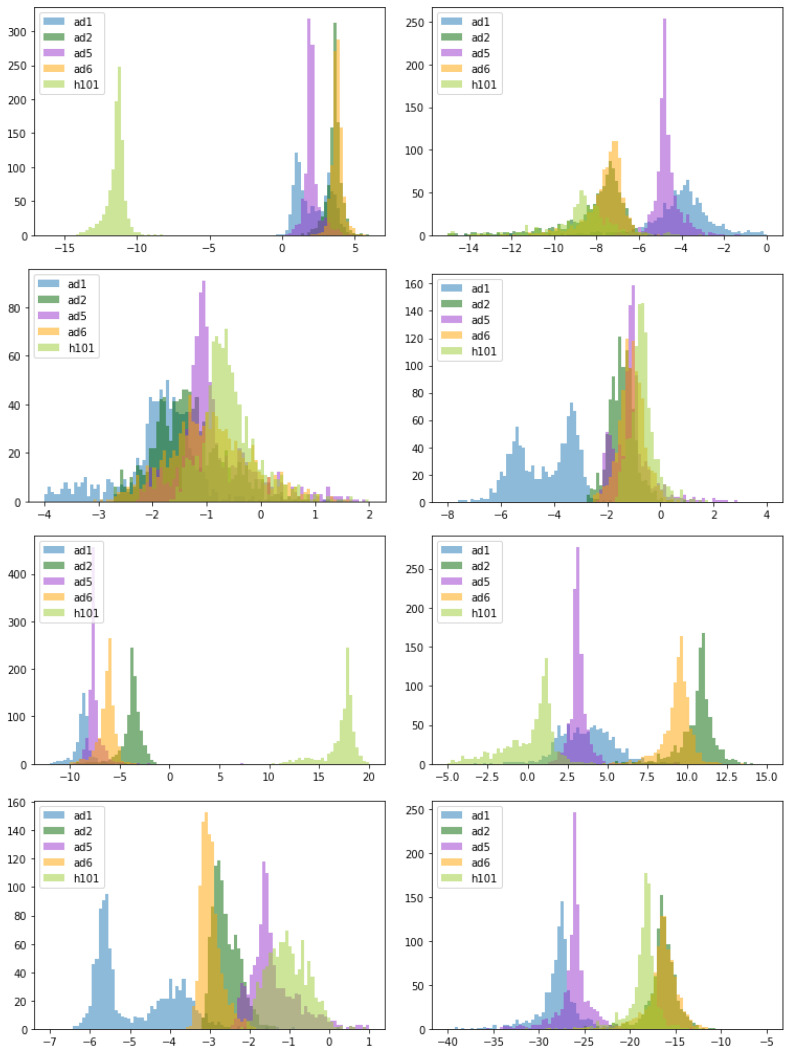
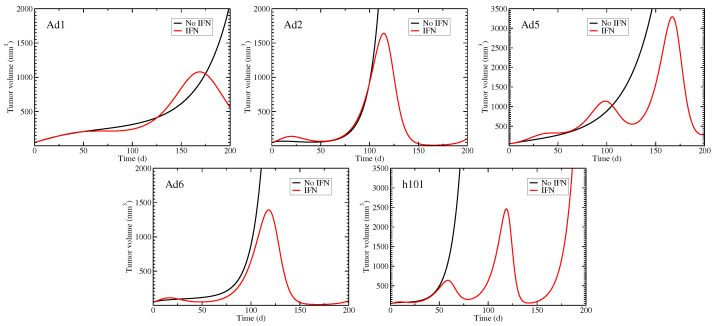
Oncolytic adenoviruses (OAds) present a promising path for cancer treatment due to their selectivity in infecting and lysing tumor cells and their ability to stimulate the immune response. In this study, we use an ordinary differential equation (ODE) model of tumor growth inhibited by oncolytic virus activity to parameterize previous research on the effect of genetically re-engineered OAds in A549 lung cancer tumors in murine models. We find that the data are best fit by a model that accounts for an immune response, and that the immune response provides a mechanism for elimination of the tumor. We also find that parameter estimates for the most effective OAds share characteristics, most notably a high infection rate and low viral clearance rate, that might be potential reasons for these viruses' efficacy in delaying tumor growth. Further studies observing E1A and P19 recombined viruses in different tumor environments may further illuminate the extent of the effects of these genetic modifications.
Keywords: cancer; immune response; interferon; mathematical model; parameter estimation.
Conflict of interest statement
The authors declare no conflict of interest.
Figures
Similar articles
-
Novel Group C Oncolytic Adenoviruses Carrying a miRNA Inhibitor Demonstrate Enhanced Oncolytic Activity In Vitro and In Vivo.Mol Cancer Ther. 2022 Mar 1;21(3):460-470. doi: 10.1158/1535-7163.MCT-21-0240. Mol Cancer Ther. 2022. PMID: 35027480 Free PMC article.
-
A novel immunocompetent murine model for replicating oncolytic adenoviral therapy.Cancer Gene Ther. 2015 Jan;22(1):17-22. doi: 10.1038/cgt.2014.64. Epub 2014 Dec 19. Cancer Gene Ther. 2015. PMID: 25525035 Free PMC article.
-
PolySia-Specific Retargeting of Oncolytic Viruses Triggers Tumor-Specific Immune Responses and Facilitates Therapy of Disseminated Lung Cancer.Cancer Immunol Res. 2015 Jul;3(7):751-63. doi: 10.1158/2326-6066.CIR-14-0124-T. Epub 2015 Feb 19. Cancer Immunol Res. 2015. PMID: 25701327
-
Chapter eight--Oncolytic adenoviruses for cancer immunotherapy: data from mice, hamsters, and humans.Adv Cancer Res. 2012;115:265-318. doi: 10.1016/B978-0-12-398342-8.00008-2. Adv Cancer Res. 2012. PMID: 23021247 Review.
-
Oncolytic viruses: adenoviruses.Virus Genes. 2017 Oct;53(5):700-706. doi: 10.1007/s11262-017-1488-1. Epub 2017 Jul 12. Virus Genes. 2017. PMID: 28702840 Review.
Cited by
-
Incorporating Intracellular Processes in Virus Dynamics Models.Microorganisms. 2024 Apr 30;12(5):900. doi: 10.3390/microorganisms12050900. Microorganisms. 2024. PMID: 38792730 Free PMC article. Review.
References
MeSH terms
LinkOut - more resources
Full Text Sources
Medical
