The Seasonality of Respiratory Viruses in a Hong Kong Hospital, 2014-2023
- PMID: 37766227
- PMCID: PMC10536933
- DOI: 10.3390/v15091820
The Seasonality of Respiratory Viruses in a Hong Kong Hospital, 2014-2023
Abstract
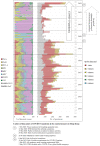
We reviewed the multiplex PCR results of 20,127 respiratory specimens tested in a hospital setting from January 2014 to April 2023. The seasonal oscillation patterns of 17 respiratory viruses were studied. Compared with 2014-2019, a prominent drop in PCR positivity (from 64.46-69.21% to 17.29-29.89%, p < 0.001) and virus diversity was observed during the COVID-19 pandemic, with predominance of rhinovirus/enterovirus, sporadic spikes of parainfluenza viruses 3 and 4, respiratory syncytial virus and SARS-CoV-2, and rare detection of influenza viruses, metapneumovirus, adenovirus and coronaviruses. The suppressed viruses appeared to regain activity from the fourth quarter of 2022 when pandemic interventions had been gradually relaxed in Hong Kong. With the co-circulation of SARS-CoV-2 and seasonal respiratory viruses, surveillance of their activity and an in-depth understanding of the clinical outcomes will provide valuable insights for improved public health measures and reducing disease burden.
Keywords: COVID-19; PCR; SARS-CoV-2; influenza; prevalence; respiratory virus; seasonality.
Conflict of interest statement
The authors declare no conflict of interest.
Figures


Similar articles
-
Wastewater concentrations of human influenza, metapneumovirus, parainfluenza, respiratory syncytial virus, rhinovirus, and seasonal coronavirus nucleic-acids during the COVID-19 pandemic: a surveillance study.Lancet Microbe. 2023 May;4(5):e340-e348. doi: 10.1016/S2666-5247(22)00386-X. Epub 2023 Mar 22. Lancet Microbe. 2023. PMID: 36965504 Free PMC article.
-
Circulation of Respiratory Viruses in Hospitalized Adults before and during the COVID-19 Pandemic in Brescia, Italy: A Retrospective Study.Int J Environ Res Public Health. 2021 Sep 9;18(18):9525. doi: 10.3390/ijerph18189525. Int J Environ Res Public Health. 2021. PMID: 34574450 Free PMC article.
-
Seasonality of coronaviruses and other respiratory viruses in Canada: Implications for COVID-19.Can Commun Dis Rep. 2021 Mar 31;47(3):132-138. doi: 10.14745/ccdr.v47i03a02. eCollection 2021 Mar 31. Can Commun Dis Rep. 2021. PMID: 34012336 Free PMC article.
-
Effects of Non-Pharmacological Interventions on Respiratory Viruses Other Than SARS-CoV-2: Analysis of Laboratory Surveillance and Literature Review From 2018 to 2021.J Korean Med Sci. 2022 May 30;37(21):e172. doi: 10.3346/jkms.2022.37.e172. J Korean Med Sci. 2022. PMID: 35638198 Free PMC article. Review.
-
Seasonal Coronaviruses and Other Neglected Respiratory Viruses: A Global Perspective and a Local Snapshot.Front Public Health. 2021 Jul 5;9:691163. doi: 10.3389/fpubh.2021.691163. eCollection 2021. Front Public Health. 2021. PMID: 34291031 Free PMC article. Review.
Cited by
-
High-throughput sequencing-based neutralization assay reveals how repeated vaccinations impact titers to recent human H1N1 influenza strains.J Virol. 2024 Oct 22;98(10):e0068924. doi: 10.1128/jvi.00689-24. Epub 2024 Sep 24. J Virol. 2024. PMID: 39315814 Free PMC article.
-
Epidemiology and diagnosis technologies of human metapneumovirus in China: a mini review.Virol J. 2024 Mar 7;21(1):59. doi: 10.1186/s12985-024-02327-9. Virol J. 2024. PMID: 38454484 Free PMC article. Review.
-
Circulation and Codetections of Influenza Virus, SARS-CoV-2, Respiratory Syncytial Virus, Rhinovirus, Adenovirus, Bocavirus, and Other Respiratory Viruses During 2022-2023 Season in Latvia.Viruses. 2024 Oct 22;16(11):1650. doi: 10.3390/v16111650. Viruses. 2024. PMID: 39599765 Free PMC article.
-
Respiratory syncytial virus hospitalization costs, rates, and seasonality in Asia: a systematic review and meta-analysis.EClinicalMedicine. 2025 Jul 10;86:103350. doi: 10.1016/j.eclinm.2025.103350. eCollection 2025 Aug. EClinicalMedicine. 2025. PMID: 40687213 Free PMC article. Review.
-
Clinical Evaluation of Xpert Xpress CoV-2/Flu/RSV plus and Alinity m Resp-4-Plex Assay.Diagnostics (Basel). 2024 Mar 24;14(7):683. doi: 10.3390/diagnostics14070683. Diagnostics (Basel). 2024. PMID: 38611596 Free PMC article.
References
-
- WHO Coronavirus (COVID-19) Dashboard. [(accessed on 2 July 2023)]. Available online: https://covid19.who.int/?topicsurvey=)
-
- COVID-19 Socio-Economic Impact. [(accessed on 3 July 2023)]. Available online: https://www.undp.org/coronavirus/socio-economic-impact-covid-19.
-
- Socio-Economic Impact of COVID-19 on Households in Indonesia: Three Rounds of Monitoring Surveys. [(accessed on 3 July 2023)]. Available online: https://www.unicef.org/indonesia/reports/socio-economic-impact-covid-19-....
-
- DH Concerned about PWH Case. Department of Health Press Release. [(accessed on 3 July 2023)]; Available online: https://www.dh.gov.hk/english/press/2003/03_03_11.html.
LinkOut - more resources
Full Text Sources
Miscellaneous

