. 2023 Aug 29;15(9):1830.
doi: 10.3390/v15091830.

Influenza A Virus Infection Alters Lipid Packing and Surface Electrostatic Potential of the Host Plasma Membrane

Affiliations

Influenza A Virus Infection Alters Lipid Packing and Surface Electrostatic Potential of the Host Plasma Membrane

Annett Petrich et al. Viruses. .

Abstract

The pathogenesis of influenza A viruses (IAVs) is influenced by several factors, including IAV strain origin and reassortment, tissue tropism and host type. While such factors were mostly investigated in the context of virus entry, fusion and replication, little is known about the viral-induced changes to the host lipid membranes which might be relevant in the context of virion assembly. In this work, we applied several biophysical fluorescence microscope techniques (i.e., Förster energy resonance transfer, generalized polarization imaging and scanning fluorescence correlation spectroscopy) to quantify the effect of infection by two IAV strains of different origin on the plasma membrane (PM) of avian and human cell lines. We found that IAV infection affects the membrane charge of the inner leaflet of the PM. Moreover, we showed that IAV infection impacts lipid-lipid interactions by decreasing membrane fluidity and increasing lipid packing. Because of such alterations, diffusive dynamics of membrane-associated proteins are hindered. Taken together, our results indicate that the infection of avian and human cell lines with IAV strains of different origins had similar effects on the biophysical properties of the PM.

Keywords: biosensors; fluorescence correlation spectroscopy; fluorescence microscopy; fluorescence resonance energy transfer; influenza A virus; lipid packing; membrane fluidity; plasma membrane; quantitative microscopy; spectral imaging.


Conflict of interest statement

The authors declare no conflict of interest.

Figures

Figure 1
Figure 1
Increase of negative surface charge at the inner leaflet of the PM in infected cells. HEK293T and DF1 cells were either: non-infected (MOCK), treated with DOPS-SUV (DOPS, positive control), infected with FPV or with WSN influenza A strains. All cells were expressing the FRET-sensor MCS+ and emission spectrum images (22 spectral channels from 499 nm to 695 nm) were acquired 16 hpi using 488 nm excitation. (A) Average normalized emission spectra of all the selected regions of interest (ROI) at the equatorial plane of HEK293T and DF1 cells expressing MCS+, following the indicated treatment. Data are represented as mean ± SD from 50–55 HEK293T cells and 21–33 DF1 cells from two independent experiments. (B) Representative ratiometric FRET images (RG ratio, pseudo-colored as indicated by the color scale) of HEK293T and DF1 cells expressing MCS+. White rectangles represent examples of ROIs at the PM selected for FRET quantification. Scale bars represent 10 µm. (C) RG ratio derived from the average intensity spectra of each cell type for the indicated treatment. Data from two separate experiments were pooled, plotted, and analyzed using a one-way ANOVA Tukey’s multiple comparison test (**** p < 0.0001). Each data point represents the average value measured for a ROI at the PM in one cell (Table S2).
Figure 2
Figure 2
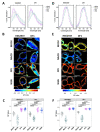
Increase of lipid packing of the PM upon IAV infection. HEK293T and DF1 cells were either non-infected (MOCK), treated with methyl-β-cyclodextrin (MbCD), infected with FPV or with WSN influenza A strains. All cells were labelled with the solvatochromic probes Laurdan (AC) and Di-4-ANEPPDHQ (DF), and then imaged 16 hpi. Averaged, normalized fluorescence emission spectra of all selected regions of interest (ROI) at the equatorial plane of HEK293T and DF1 cells stained with Laurdan (A) or Di-4-ANEPPDHQ (D), for the indicated treatment. Data are represented as mean ± SD of 52–110 cells stained with Laurdan and 36–127 cells stained with Di-4-ANEPPDHQ from three independent experiments (Tables S3 and S4). Representative ratiometric GP images (GP index, pseudo-colored as indicated by the color scale) of HEK293T and DF1 cells stained with Laurdan (B) or Di-4-ANEPPDHQ (E). White lines represent examples of ROIs at the PM selected for GP index quantification. Scale bars represent 10 µm. GP index derived from the average intensity spectra from Laurdan- (C) or Di-4-ANEPPDHQ-stained (F) cells for each cell type and indicated treatment. Data from three separate experiments were pooled, plotted, and analyzed using one-way ANOVA Tukey´s multiple comparison test (**** p < 0.0001). Each data point represents the average value measured for a ROI at the PM in one cell (Tables S3 and S4).
Figure 3
Figure 3
Decrease of membrane protein diffusion upon IAV-infection. Quantitative analysis of protein diffusion via fluorescence correlation spectroscopy (sFCS) in non-infected (MOCK) and FPV-/WSN-infected HEK293T and DF1 cells expressing three model proteins labelled with green fluorescent proteins (mEGFPs) and associated with the plasma membrane (PM). Specifically, we investigated (i) a construct anchored to the inner leaflet of the PM via a myristoylated and palmitoylated (mp) peptide (mp-mEGFP), (ii) a construct anchored to the outer leaflet of the PM via a glycosylphosphatidylinositol (GPI) anchor (GPI-mEGFP), and (iii) one representative transmembrane protein, i.e., the influenza envelope protein hemagglutinin (HA-mEGFP). Measurements were performed at 16 hpi. The box plots show the diffusion coefficients calculated from sFCS diffusion times. Data from three separate experiments were plotted and analyzed using one-way ANOVA Tukey´s multiple comparison test (* p < 0.05, *** p < 0.001, **** p < 0.0001). Each data point represents the value measured at the PM in one cell (Table S5).

References

    1. Tam V.C., Quehenberger O., Oshassnsky C.M., Suen R., Armando A.M., Treuting P.M., Thomas P.G., Dennis E.A., Aderem A. Lipidomic Profiling of Influenza Infection Identifies Mediators that Induce and Resolve Inflammation. Cell. 2013;154:213–227. doi: 10.1016/j.cell.2013.05.052. - DOI - PMC - PubMed
    1. Taubenberger J.K., Kash J.C. Influenza virus evolution, host adaptation, and pandemic formation. Cell Host Microbe. 2010;7:440–451. doi: 10.1016/j.chom.2010.05.009. - DOI - PMC - PubMed
    1. Schrauwen E.J.A., Fouchier R.A.M. Host adaptation and transmission of influenza A viruses in mammals. Emerg. Microbes Infect. 2014;3:e9. doi: 10.1038/emi.2014.9. - DOI - PMC - PubMed
    1. Cui L., Zheng D., Lee Y.H., Chan T.K., Kumar Y., Ho W.E., Chen J.Z., Tannenbaum S.R., Ong C.N. Metabolomics Investigation Reveals Metabolite Mediators Associated with Acute Lung Injury and Repair in a Murine Model of Influenza Pneumonia. Sci. Rep. 2016;6:26076. doi: 10.1038/srep26076. - DOI - PMC - PubMed
    1. Ivanova P.T., Myers D.S., Milne S.B., McClaren J.L., Thomas P.G., Brown H.A. Lipid composition of viral envelope of three strains of influenza virus—Not all viruses are created equal. ACS Infect. Dis. 2015;1:399–452. doi: 10.1021/acsinfecdis.5b00040. - DOI - PMC - PubMed

Publication types