. 2023 Sep 16;15(9):1937.
doi: 10.3390/v15091937.

Real-Time Analysis of SARS-CoV-2-Induced Cytolysis Reveals Distinct Variant-Specific Replication Profiles

Affiliations

Real-Time Analysis of SARS-CoV-2-Induced Cytolysis Reveals Distinct Variant-Specific Replication Profiles

Sarah E Scheuermann et al. Viruses. .

Abstract

The ability of each new SARS-CoV-2 variant to evade host humoral immunity is the focus of intense research. Each variant may also harbor unique replication capabilities relevant for disease and transmission. Here, we demonstrate a new approach to assessing viral replication kinetics using real-time cell analysis (RTCA). Virus-induced cell death is measured in real time as changes in electrical impedance through cell monolayers while images are acquired at defined intervals via an onboard microscope and camera. Using this system, we quantified replication kinetics of five clinically important viral variants: WA1/2020 (ancestral), Delta, and Omicron subvariants BA.1, BA.4, and BA.5. Multiple measures proved useful in variant replication comparisons, including the elapsed time to, and the slope at, the maximum rate of cell death. Important findings include significantly weaker replication kinetics of BA.1 by all measures, while BA.5 harbored replication kinetics at or near ancestral levels, suggesting evolution to regain replicative capacity, and both an altered profile of cell killing and enhanced fusogenicity of the Delta variant. Together, these data show that RTCA is a robust method to assess replicative capacity of any given SARS-CoV-2 variant rapidly and quantitatively, which may be useful in assessment of newly emerging variants.

Keywords: SARS-CoV-2 variants; real-time cell analysis; viral replication.


Conflict of interest statement

The authors declare no conflict of interest.

Figures

Figure 1
Figure 1
Kinetic comparisons of Vero-TMPRSS2 cells inoculated with multiple SARS-CoV-2 variants of concern. Time to reach max slope of inoculated cells (A) and area under the curve (AUC) (B) of cell index. Data are represented as mean with SEM. Groups were compared via Kruskal–Wallis test (*, p < 0.05; **, p < 0.01; ***, p < 0.001; ****, p < 0.0001). Data were collected from 6 replicate wells for each condition. The optical density value at 450 nm of each variant across multiple viral concentrations over time is represented as means with SEM (C).
Figure 2
Figure 2
Slope of Vero/TMPRSS2 monolayers inoculated with SARS-CoV-2 variants. The value of each variant’s slope across multiple viral concentrations over time is represented as means with SEM. Legend indicates quantity of virus in TCID50 added onto cell monolayers (A). The value of each variant’s max slope across multiple viral concentrations graphed as averages with SEM (B). Groups were compared via Kruskal–Wallis test (*, p < 0.05; **, p < 0.01; ***, p < 0.001; ****, p < 0.0001). Data were collected from 6 replicate wells for each experimental condition.
Figure 3
Figure 3
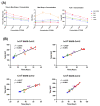
Slope and AUC relationships of SARS-CoV-2 variants. Relationships between time to max slope, value of max slope, and AUC with varying viral concentrations applied to cell monolayers (A). Relationship between AUC and time to reach max slope for each variant. p value represents Spearman correlation (B).
Figure 4
Figure 4
Monolayers visualized during replication. Images of monolayers taken 5 h prior to each variant’s maximum slope time point for Vero/TMPRSS2 inoculated with (A) 1 × 10⁵ TCID50 or (B) 1 × 10⁴ TCID50 SARS-CoV-2.

References

    1. Holshue M.L., DeBolt C., Lindquist S., Lofy K.H., Wiesman J., Bruce H., Spitters C., Ericson K., Wilkerson S., Tural A., et al. First Case of 2019 Novel Coronavirus in the United States. N. Engl. J. Med. 2020;382:929–936. doi: 10.1056/NEJMoa2001191. - DOI - PMC - PubMed
    1. Grubaugh N.D., Hanage W.P., Rasmussen A.L. Making Sense of Mutation: What D614G Means for the COVID-19 Pandemic Remains Unclear. Cell. 2020;182:794–795. doi: 10.1016/j.cell.2020.06.040. - DOI - PMC - PubMed
    1. Volz E., Hill V., McCrone J.T., Price A., Jorgensen D., O'Toole A., Southgate J., Johnson R., Jackson B., Nascimento F.F., et al. Evaluating the Effects of SARS-CoV-2 Spike Mutation D614G on Transmissibility and Pathogenicity. Cell. 2021;184:64–75.e11. doi: 10.1016/j.cell.2020.11.020. - DOI - PMC - PubMed
    1. Grint D.J., Wing K., Houlihan C., Gibbs H.P., Evans S.J.W., Williamson E., McDonald H.I., Bhaskaran K., Evans D., Walker A.J., et al. Severity of SARS-CoV-2 alpha variant (B.1.1.7) in England. Clin. Infect. Dis. 2022;75:e1120–e1127. doi: 10.1093/cid/ciab754. - DOI - PMC - PubMed
    1. Meng B., Kemp S.A., Papa G., Datir R., Ferreira I., Marelli S., Harvey W.T., Lytras S., Mohamed A., Gallo G., et al. Recurrent emergence of SARS-CoV-2 spike deletion H69/V70 and its role in the Alpha variant B.1.1.7. Cell Rep. 2021;35:109292. doi: 10.1016/j.celrep.2021.109292. - DOI - PMC - PubMed

Publication types

Supplementary concepts